XRP’s positive momentum could be cut short; retracement to $0.16?

XRP has been lagging for quite some time now. Upswings appear to have been paused and a strong rally for the coin is yet to materialize. At press time, XRP was priced at $0.191.
XRP 6-Hour Chart:

Source: XRP/USD on TradingView
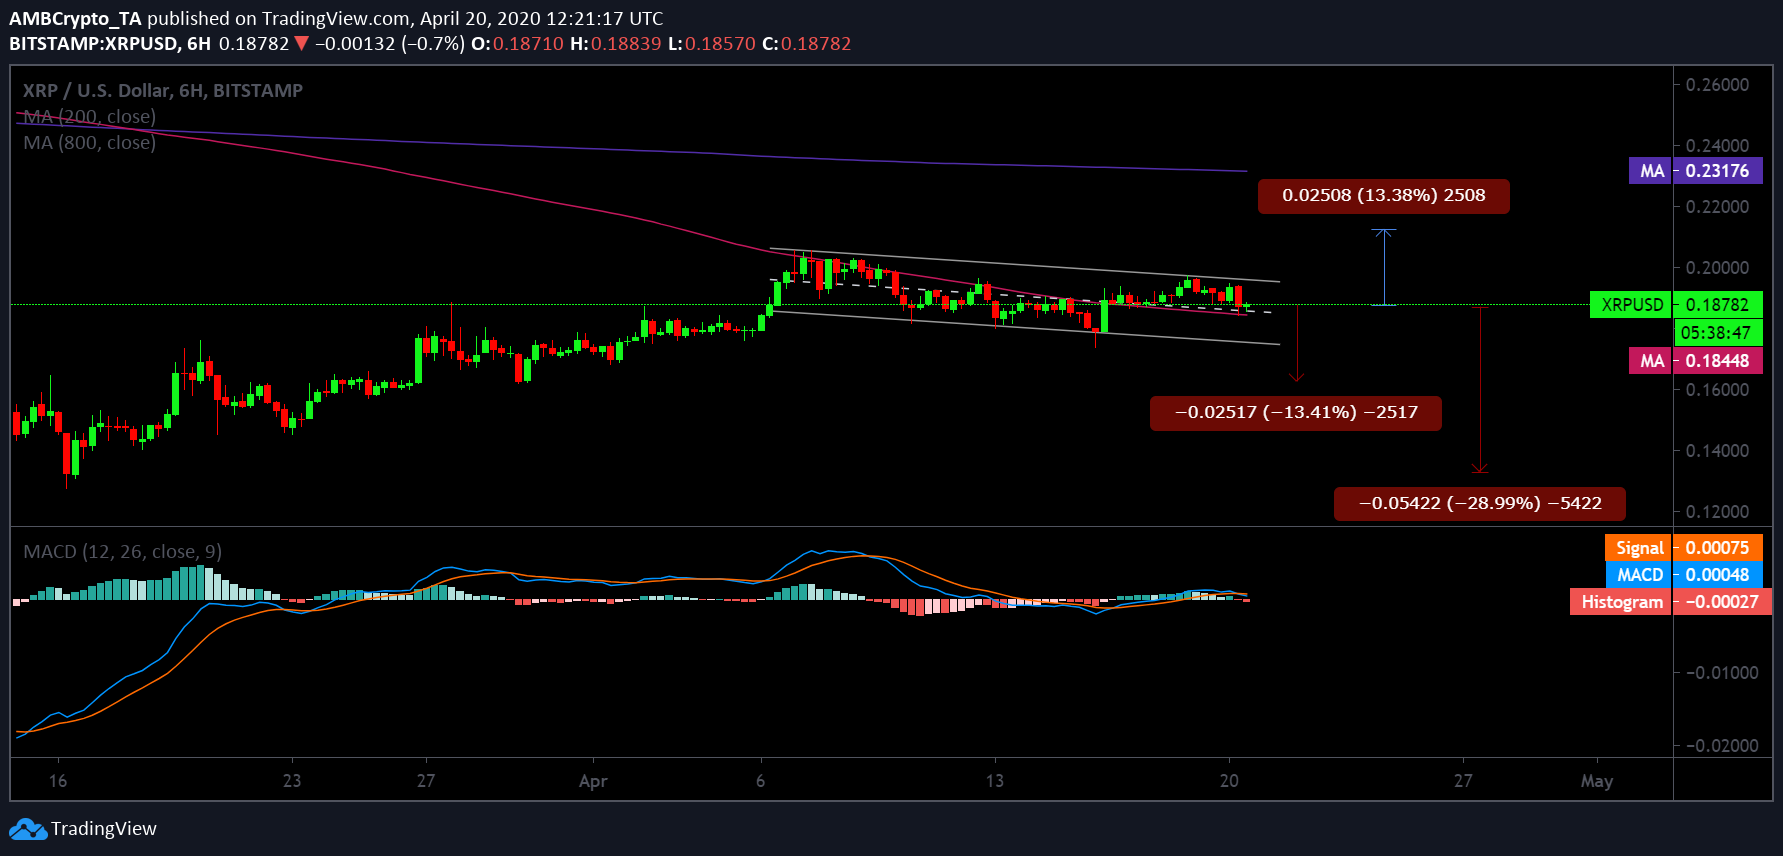
The formation of a descending channel pattern on the six-hour chart of XRP signaled the declining price along the channel. The price candles tried to break the pattern even lower on the 15th of April, however, soon after retaining a bullish momentum, XRP went up to continue swinging between the two trendlines, a pattern that has been in shape since 6th April. This indicated a bullish breakout in the near-term.
After a long tryst with the bears, thanks to several pullbacks, XRP appeared to have finally gotten the much-needed bullish break. However, moving averages had a different story to tell. The 50 daily moving average [Pink] was well above the 200 daily moving average [Violet]. The death cross that occurred on 18th March has failed to flip positive. Additionally, the expanding gauge between the moving averages has further added to its woes.
Further aligning with the bears was MACD indicator, which underwent a bearish crossover on 20th April.
Scenario 1
The above fundamentals indicated there was a hint of a potential bullish breakout on the short-term, but the anticipation was shut down as the moving averages and MACD weighed in. This could push the coin to support at $0.162. If the negative trend persists and gains traction, XRP could also retest $0.132-level.
Scenario 2:
However, in the case of a bullish breakout, supported by the descending channel indicator, the resistance point for the coin was $0.210.
Correlation:

Source: CoinMetrics
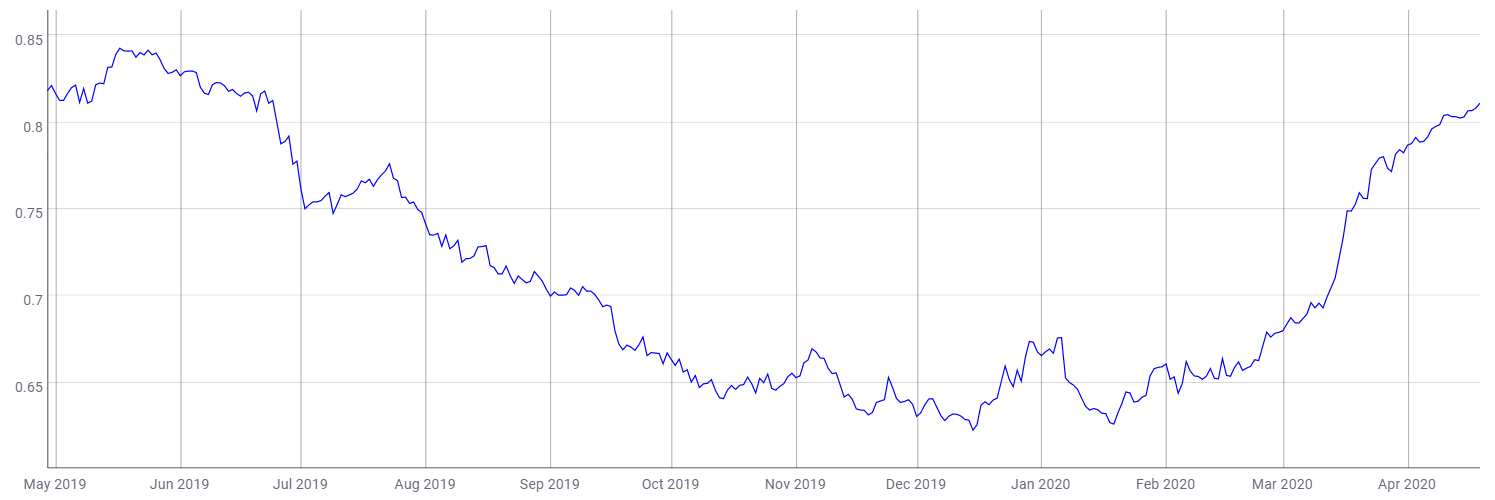
As the market matured, the alts have started to mimic the price action of Bitcoin even more. As for the third-largest cryptocurrency, BTC-XRP correlation coefficient stood at 0.81. The increasing correlation indicated that Bitcoin’s rise is a crucial element required for a bullish breakout of XRP in the near term.
Conclusion:
In the short-term, if bulls breakout, the coin could find itself climbing all the way up to $0.21, thereby breaking a crucial resistance. As the fundamentals depicted a bearish picture for the coin, support levels stood at $0.162, $0.132.


