
The short-term chart of XRP was unique at the moment as the collective asset class itself. The crypto ecospace is used as an invalidation of market patterns in the past, but the recent spike is a clear example of external factors moving the market at an instant, and away from a legitimate opposite trend.
XRP 1-hour chart

Source: XRP/USD on Trading View
We analyzed the 1-hour chart of XRP and as observed, a complete U-turn was witnessed. Before arriving at the conclusion, let us look at the market before the breakout. After reaching a local top of $0.265 on the 7th of November, XRP registered a quick period of correction, dropping below key support at $0.258 and $0.249. A short-term bearish scenario was again observed which led to the 50-Moving Average rising above the candlesticks. Attaining a descending triangle pattern, XRP seemed prime to drop below $0.249 yet again.
However, the tables flipped soon after. On 7:00 UTC 10th November, XRP’s price exhibited a flash hike of 4.22 percent which took its valuation above $0.258. Now, in the past couple of hours, the asset has been able to hold its own above the resistance.
While there were no market signs for a bullish breakout, Ripple’s move might have created the market scenario. Reports suggested that the organization bought in $46 million worth of XRP, and the breakout of the news might have stirred the FOMO pot. However, as we speak the price is beginning to tumble again, with XRP being extremely close to $0.258.
Market Indicators
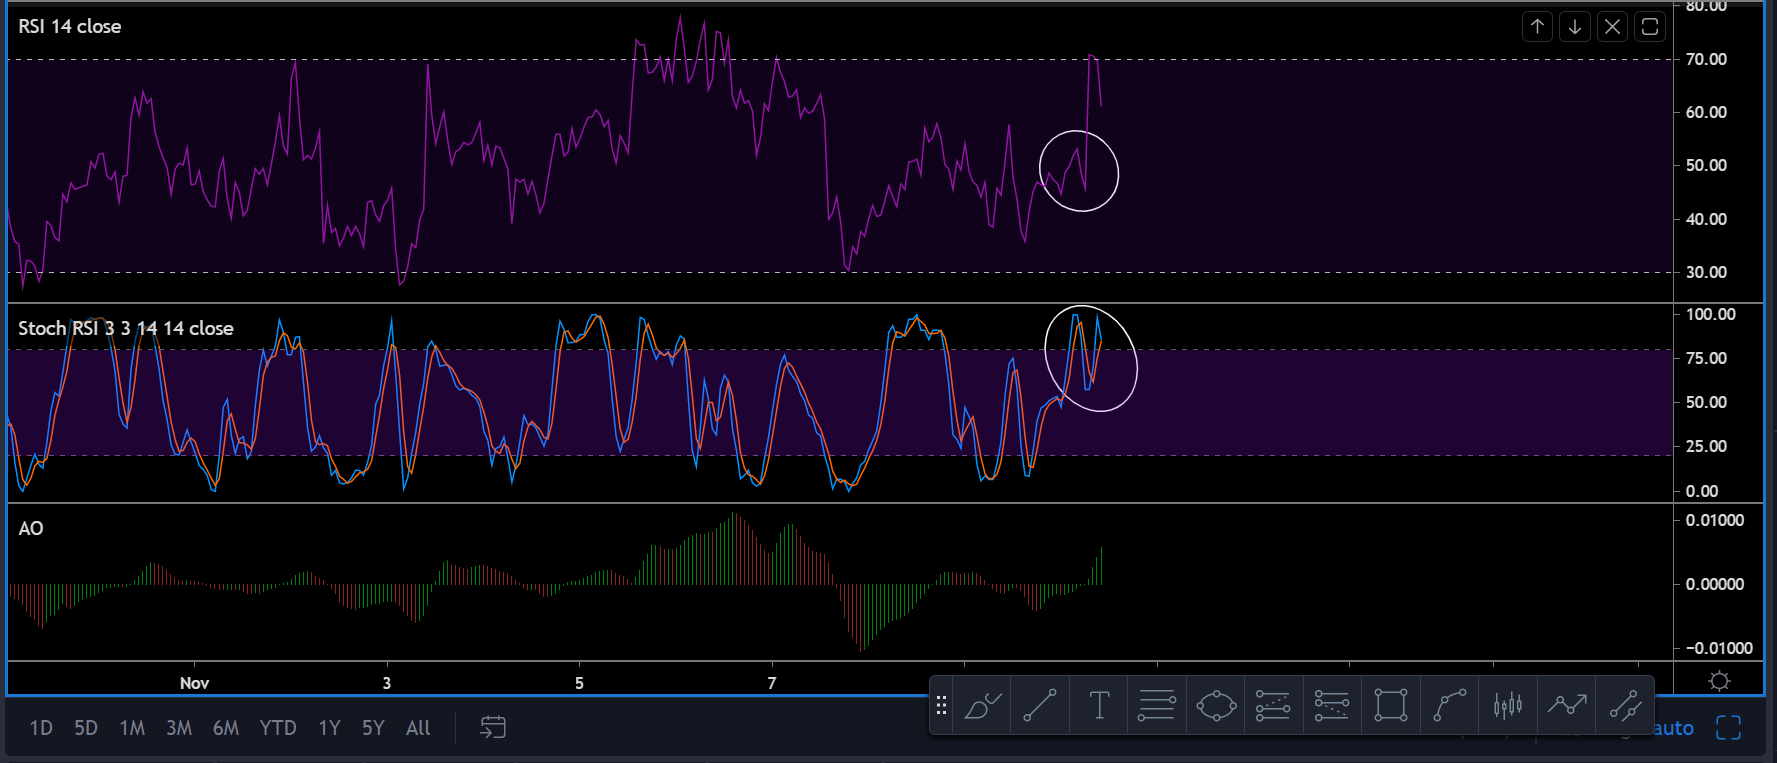
Source: XRP/USD on Trading View
The market indicators suggested a quick 180-shift as well with the price indicative of a sudden rise following a certain bearish trend. However, the trend might go down from here on. Relative Strength Index or RSI is moving down as we speak, with the buyers showing a lack of strength at press time.
Stochastic RSI is also bearish with the blue line nearing a bearish crossover near the overbought region.
Awesome Oscillator or AO indicated a rise in bullish momentum which may play an important role to hold the valuation up but other indicators were confluence towards a drop.