
Disclaimer: The information presented does not constitute financial, investment, trading, or other types of advice and is solely the writer’s opinion.
- XRP has a short-term bearish bias.
- A dip below $0.6 was possible, but it would give swing traders an opportunity to go long.
Ripple [XRP] prices surged to $0.75 on the 13th of November after fake news of an XRP exchange-traded fund (ETF) made the rounds on the social media platform X (formerly Twitter).
Moreover, market observers noted that news of altcoin ETFs would remain farfetched for years to come.
Technical analysis by AMBCrypto on the 7th of November showed that the $0.715 was a critical resistance level. While XRP tested this level and even briefly pushed above it on Monday, the bulls were unable to flip it to support.
The Fibonacci retracement levels could help understand where XRP could turn bullish

Source: XRP/USDT on TradingView
The one-day chart showed that the market structure has flipped bearishly. XRP set a higher low at $0.63 on the 9th of November, but its dip below this mark on the 14th of November meant the bears have control now.
However, the RSI continued to move above the neutral 50 mark to show an uptrend in progress.
The On-Balance Volume stuttered over the past week and failed to make new highs as selling pressure took over. Yet, the sellers were not dominant, and a downtrend had not commenced on the OBV.
The Fibonacci retracement levels showed that the 61.8% and 78.6% places of interest sat at $0.572 and $0.528. The $0.585 was also a support level based on late October’s price action.
Hence, a move to the $0.528-$0.585 region would give buyers a chance to regain control. On the other hand, a move below $0.528 would mean a downtrend was likely in play.
The important liquidity zones have been tested over the past week – where to next?
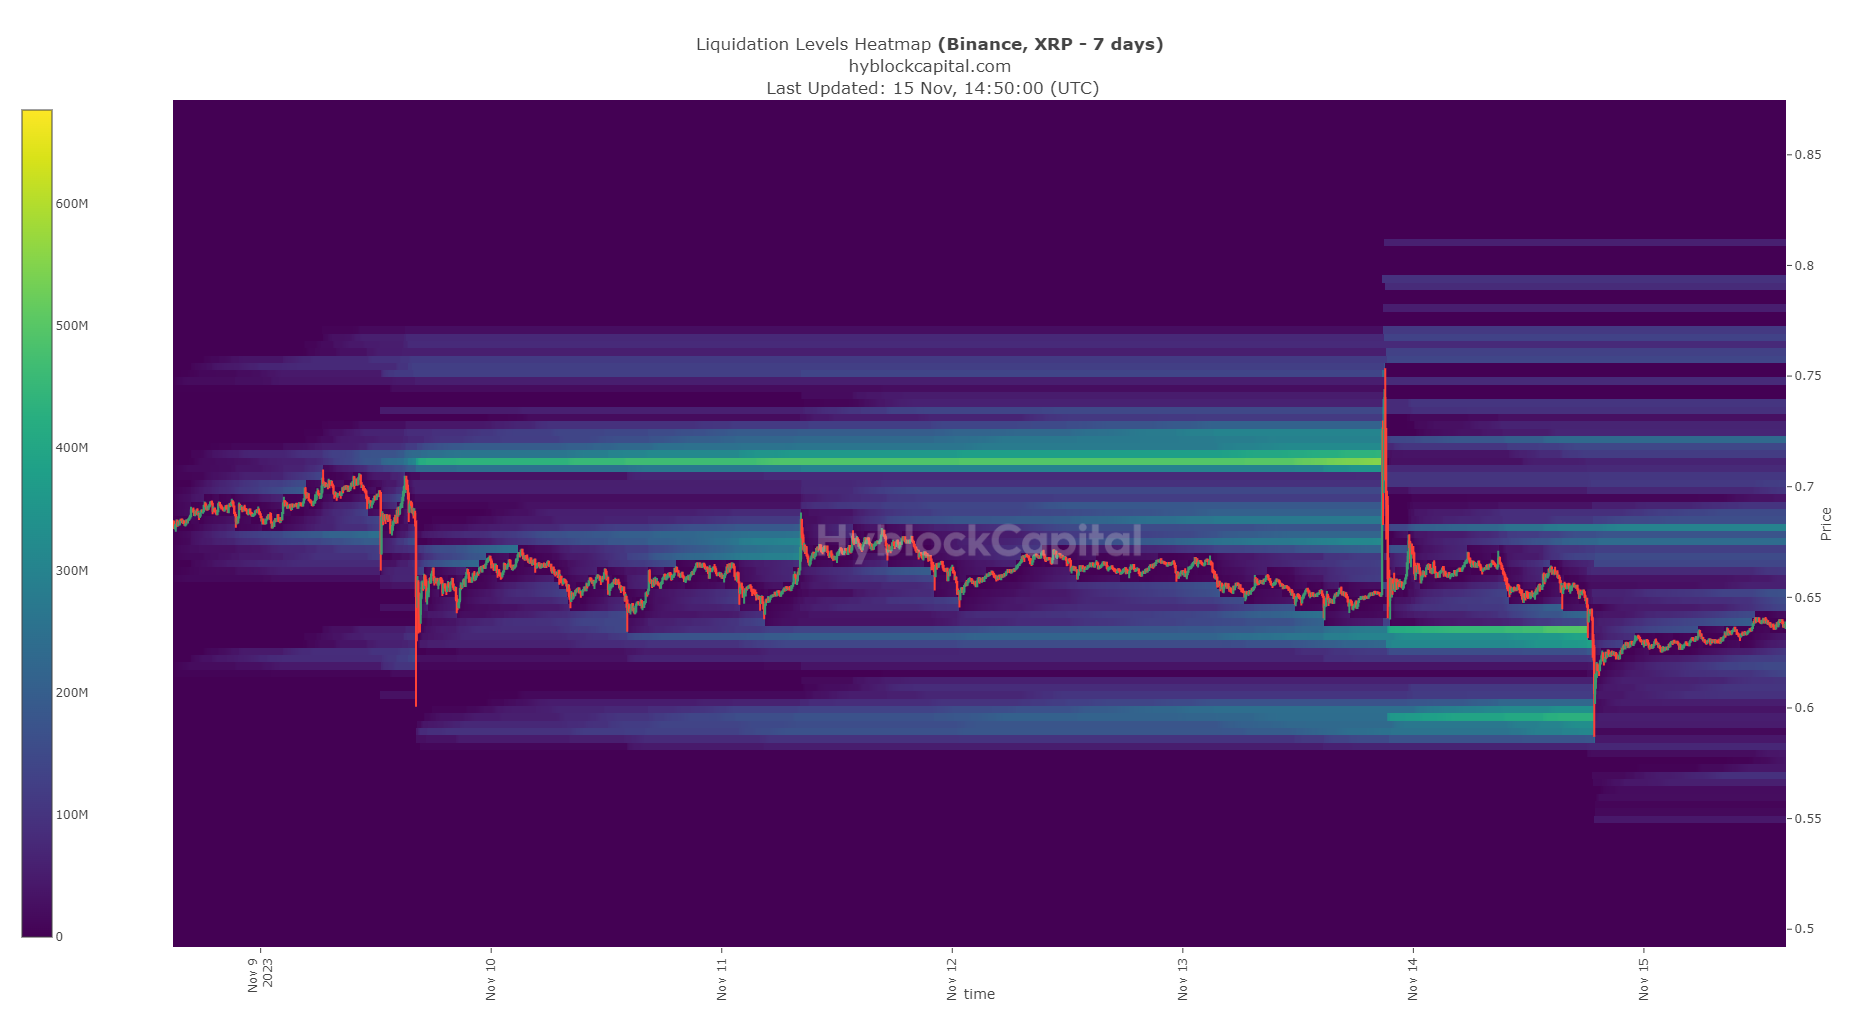
Source: Hyblock
AMBCrypto’s analysis of Hyblock data revealed that the market participants have endured a lot of pain in the past week alone. On the 13th of November, a large pocket of liquidity at $0.71-$0.73 was taken out as the fake ETF news spread across the internet.
Read Ripple’s [XRP] Price Prediction 2023-24
Once the news was debunked a few hours later, XRP dumped to $0.589, sweeping two liquidity pockets at $0.655 and $0.59. Liquidation data from Coinglass showed $11.81 million liquidated in the past 24 hours.
Of that, $11.46 million were positioned long. This meant that market sentiment was fearful in the short term as fears of volatility grip participants.