XRP has been in troubled waters for quite some time. In fact, the latest market recovery has failed to catapult the coin above the $0.200-mark. At the time of writing, the third-largest cryptocurrency by market cap, XRP, was noting a valuation of $0.194 after a minor surge of 2.86% over the past 24-hours. While the market may be gearing up for another positive ride, XRP might potentially be stuck in the bearish realm for some time.
XRP Daily Chart

Source: XRP/USD on TradingView
The daily XRP chart registered the formation of an ascending channel pattern that has been taking shape for more than a month now, starting from the fateful Black Thursday market crash which threw the coin off-guard as it landed in the bearish zone. XRP’s price candles have continued to oscillate between the two upward-sloping trendlines of the pattern.
The candles did attempt a break out to the positive side when XRP rallied in the first week of April; however, it soon fell back towards the lower trendline to continue the pattern, indicating a bearish breakout in the near-term.
The moving averages also aligned with the bears as the 50 daily moving average appeared to be hovering well below the 200 daily moving average. Interestingly, the said daily moving averages underwent a golden cross on 25 February this year, when the collective crypto-market was observed to be rallying.
This was, however, short-lived, and lasted for little over a fortnight. As the bearish pressure weighed in, the 50 DMA slid below the 200 DMA on 16 March. The gauge has since been expanding and there are no signs of a potential upswing by the 50 DMA above that of 200. This further validated the presence of bearishness in XRP’s charts.
The RSI, however, was a disputed cause. After a high-sell off phase, the RSI indicator was on the rise and at the time of writing, stood above the 50-median neutral zone as it appeared to be climbing higher. This indicated a positive sentiment of high buying pressure in the XRP market.
While $0.200 continued to be an obstacle for the coin, XRP bulls were severely resisted by the 200 DMA at the $0.232-level, while its support stood firm at points $0.140 and $0.100.
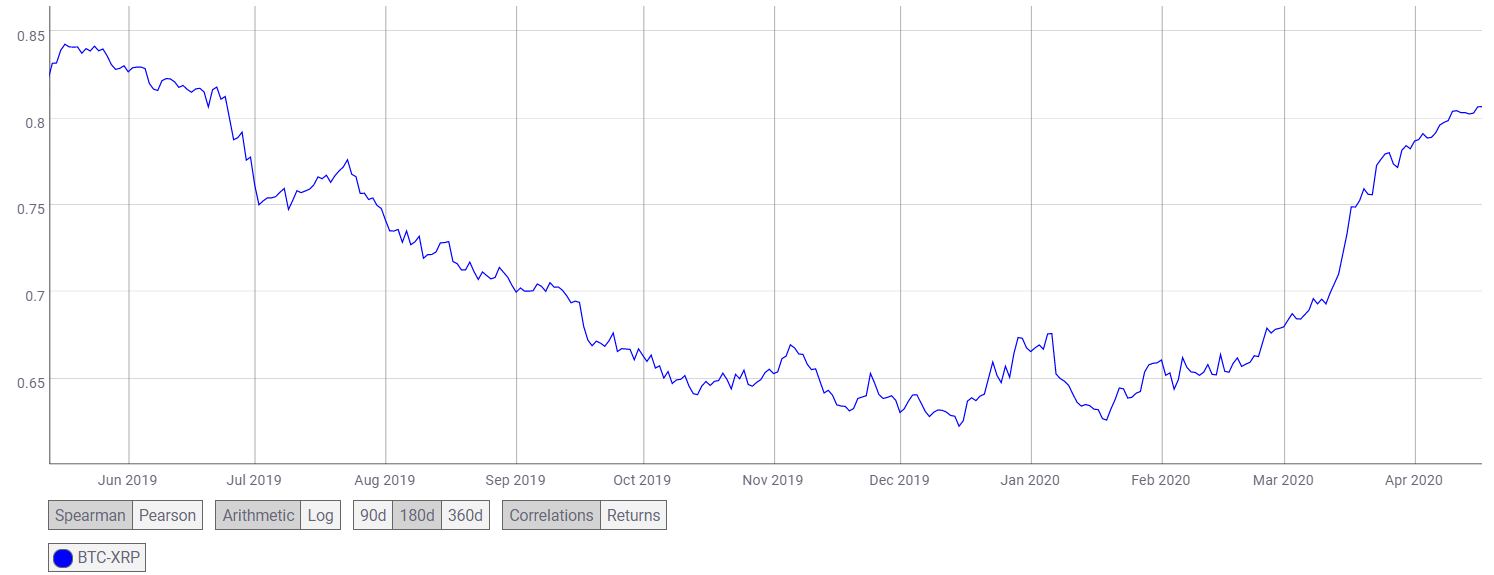
Source: CoinMetrics
Like most other cryptocurrencies, XRP too closely mimics the price movement of Bitcoin. The BTC-XRP correlation coefficient stood at 0.806, at press time. As a result, several pullbacks after the crash was the impact of Bitcoin’s market corrections on the negative side. While Bitcoin climbed above the $7,000-level following the recent rally, a pullback below this point would lead the entire crypto-market, including XRP, to retest its support levels.
At the time of writing, Bitcoin was priced at $7232 with a 24-hour volume of $13.9B.
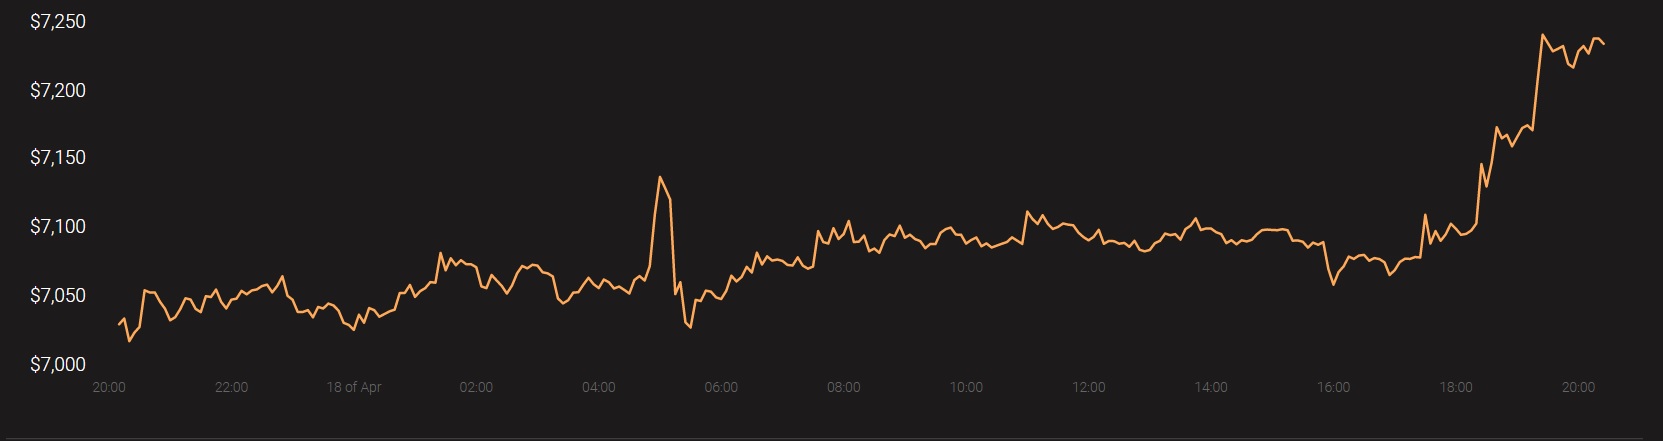
Source: Coinstats
Conclusion
The formation of an ascending channel pattern along with the expanding gauge of the moving averages indicated a potential bearish phase for the coin in the near-term. This could lead to XRP potentially retesting its support level at $0.140. If the bearish trend persists, the coin could find itself close to $0.100, a level that was last seen in May 2017.
However, in case of a highly unlikely scenario of a bullish breakout, XRP could be heavily resisted at $0.232.