XRP

XRP’s future doubtful as descending triangle, falling wedge patterns project differing fortunes
Posted:

XRP’s price has been on a decline for a while now and has continued to flirt with the $0.25 key level, trading at just a little higher. The price depreciation had previously sparked debate about Ripple dumping XRP in the market. Following the price movements, XRP was up by 0.62% over the last 24 hours and was priced at $0.258, at press time. The third-largest cryptocurrency in the market held a market cap of $11.11 billion and its 24-hour trading volume stood at $1.02 billion.
Despite the fact that the cryptocurrency showed some signs of recovery, XRP’s price remained highly volatile and the charts below depict a bear market for the cryptocurrency.
Scenario 1
In the first case, the daily chart for XRP’s price movements exhibited a Symmetrical Triangle with prices moving between two converging trendlines. The Symmetrical Triangle pattern has been extending for the past 33 days. In this case, the direction of price movement in the near term was highly speculative and a price breakout could be expected in either direction.
1-day XRP Chart
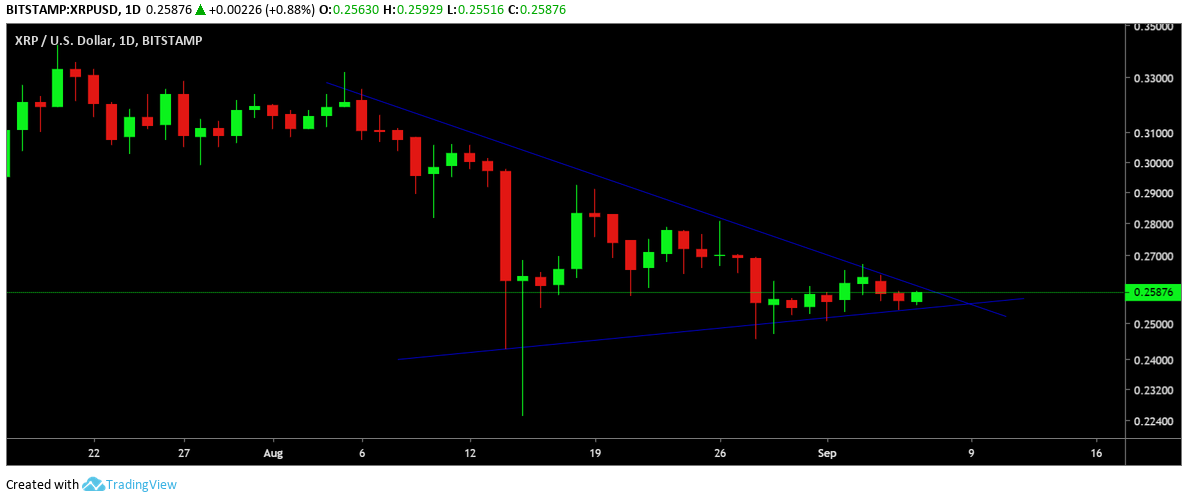
Source: TradingView
Scenario 2
For the same time frame, XRP’s price movement depicted a Descending triangle pattern. The price pattern was bound by two trendlines, with the bottom one being horizontal and the top sloping downwards has been extending for a period of 33 days. This scenario was indicative of a possible dip in XRP’s value in the near term.
1-day XRP Chart
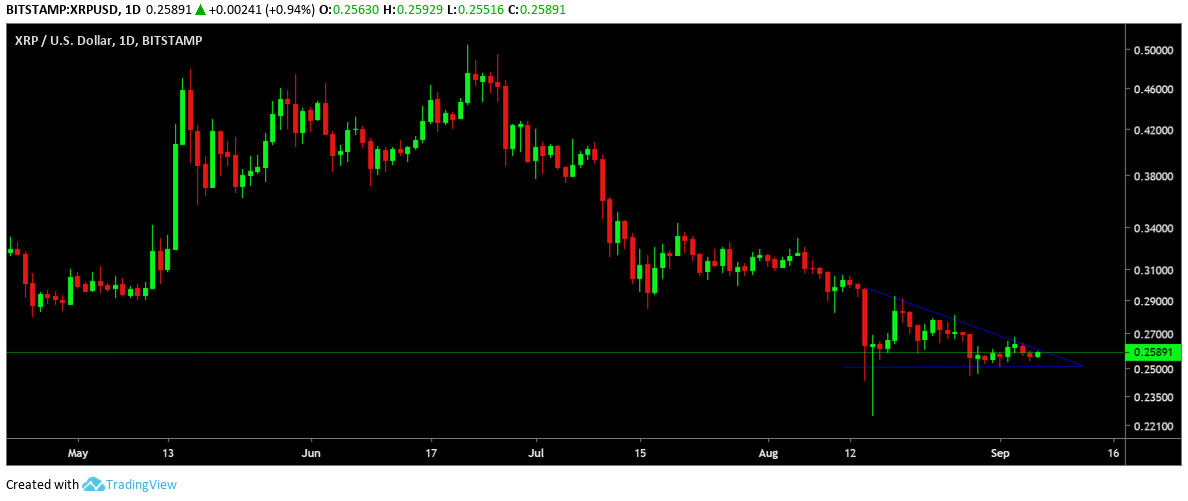
Source: TradingView
7-day XRP Chart
The weekly XRP chart depicted a Falling Wedge pattern, with the price following two downsloping and converging trendlines. This pattern suggested a possible upward price breakout. However, the MACD line hovering below the signal line also highlighted a bearish wave for the cryptocurrency.
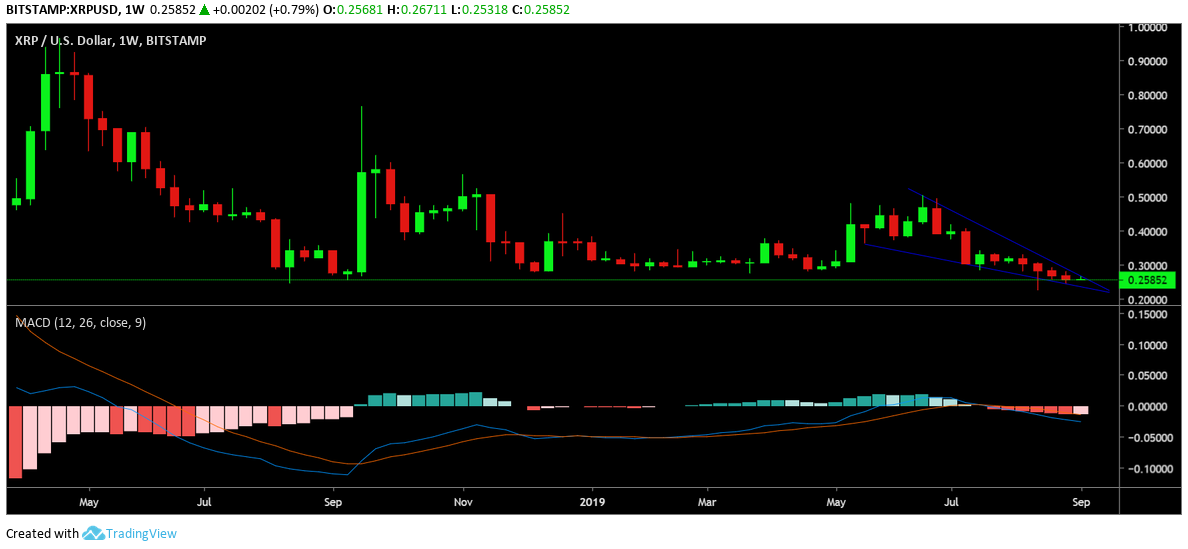
Source: TradingView
Conclusion
The daily chart for XRP pictured a possible downward price breakout. The weekly chart also showed signs of a possible bearish phase for the coin, with the MACD indicator suggesting the same.