Tezos, Monero, Stellar Lumens Price Analysis: 1 September

Tezos was trading at important retracement levels but lacked momentum in the short-term while Monero suggested a possible bullish signal, and might be able to flip a resistance level to support if the divergence played out. But it did not suggest a strong buying opportunity at the time of writing. Stellar found resistance at a moving average and a further price drop could be in store.
Tezos [XTZ]

Source: XTZ/USD on TradingView
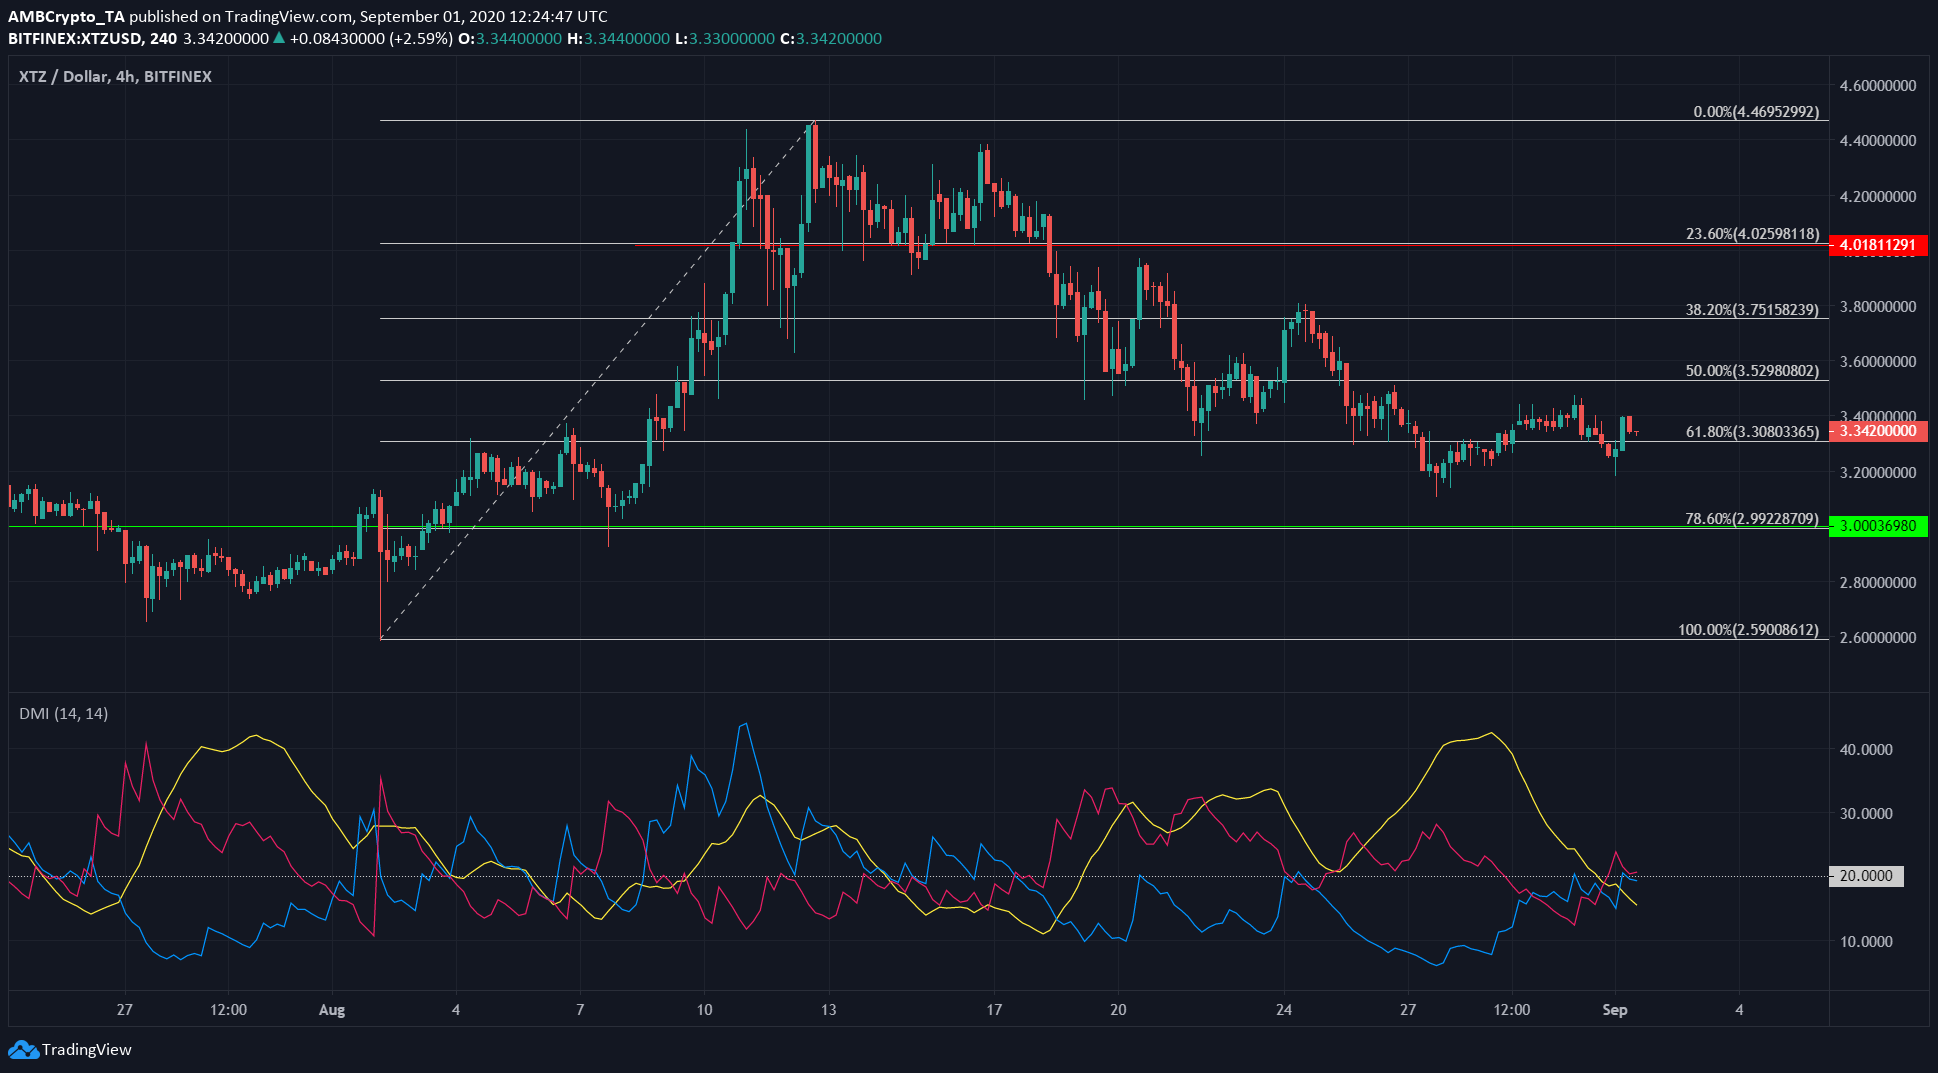
Tezos was trading at the 61.8% retracement level highlighted by the Fibonacci Retracement tool. That signified a 61.8% retracement of the gains made on the surge from $2.59 to ATH at $4.47.
DMI showed a lack of strength of any trend for XTZ, as ADX (yellow) was well below 20 line. Beneath the 0.618 level is also a long term support at $3, which coincides nicely with the 78.6% retracement, and would prove to be a strong level of support.
It is possible that XTZ bounced off the 0.618 level after surging past it a few sessions ago. Yet, XTZ needs some momentum to target some resistance levels above.
In other recent news, Attorney Alexander Lieu released a statement that the litigation against Tezos Foundation has officially come to an end. This lawsuit was filed in December 2017, after Tezos raised $232 million in its 2017 ICO, with the dispute being that this was an unlicensed securities sale.
Monero [XMR]

Source: XMR/USDT on TradingView
Monero is one of the foremost privacy coin. That claim might be shattered, when CipherTrace. a leading blockchain intelligence company, announced the world’s first capability of tracking Monero transactions.
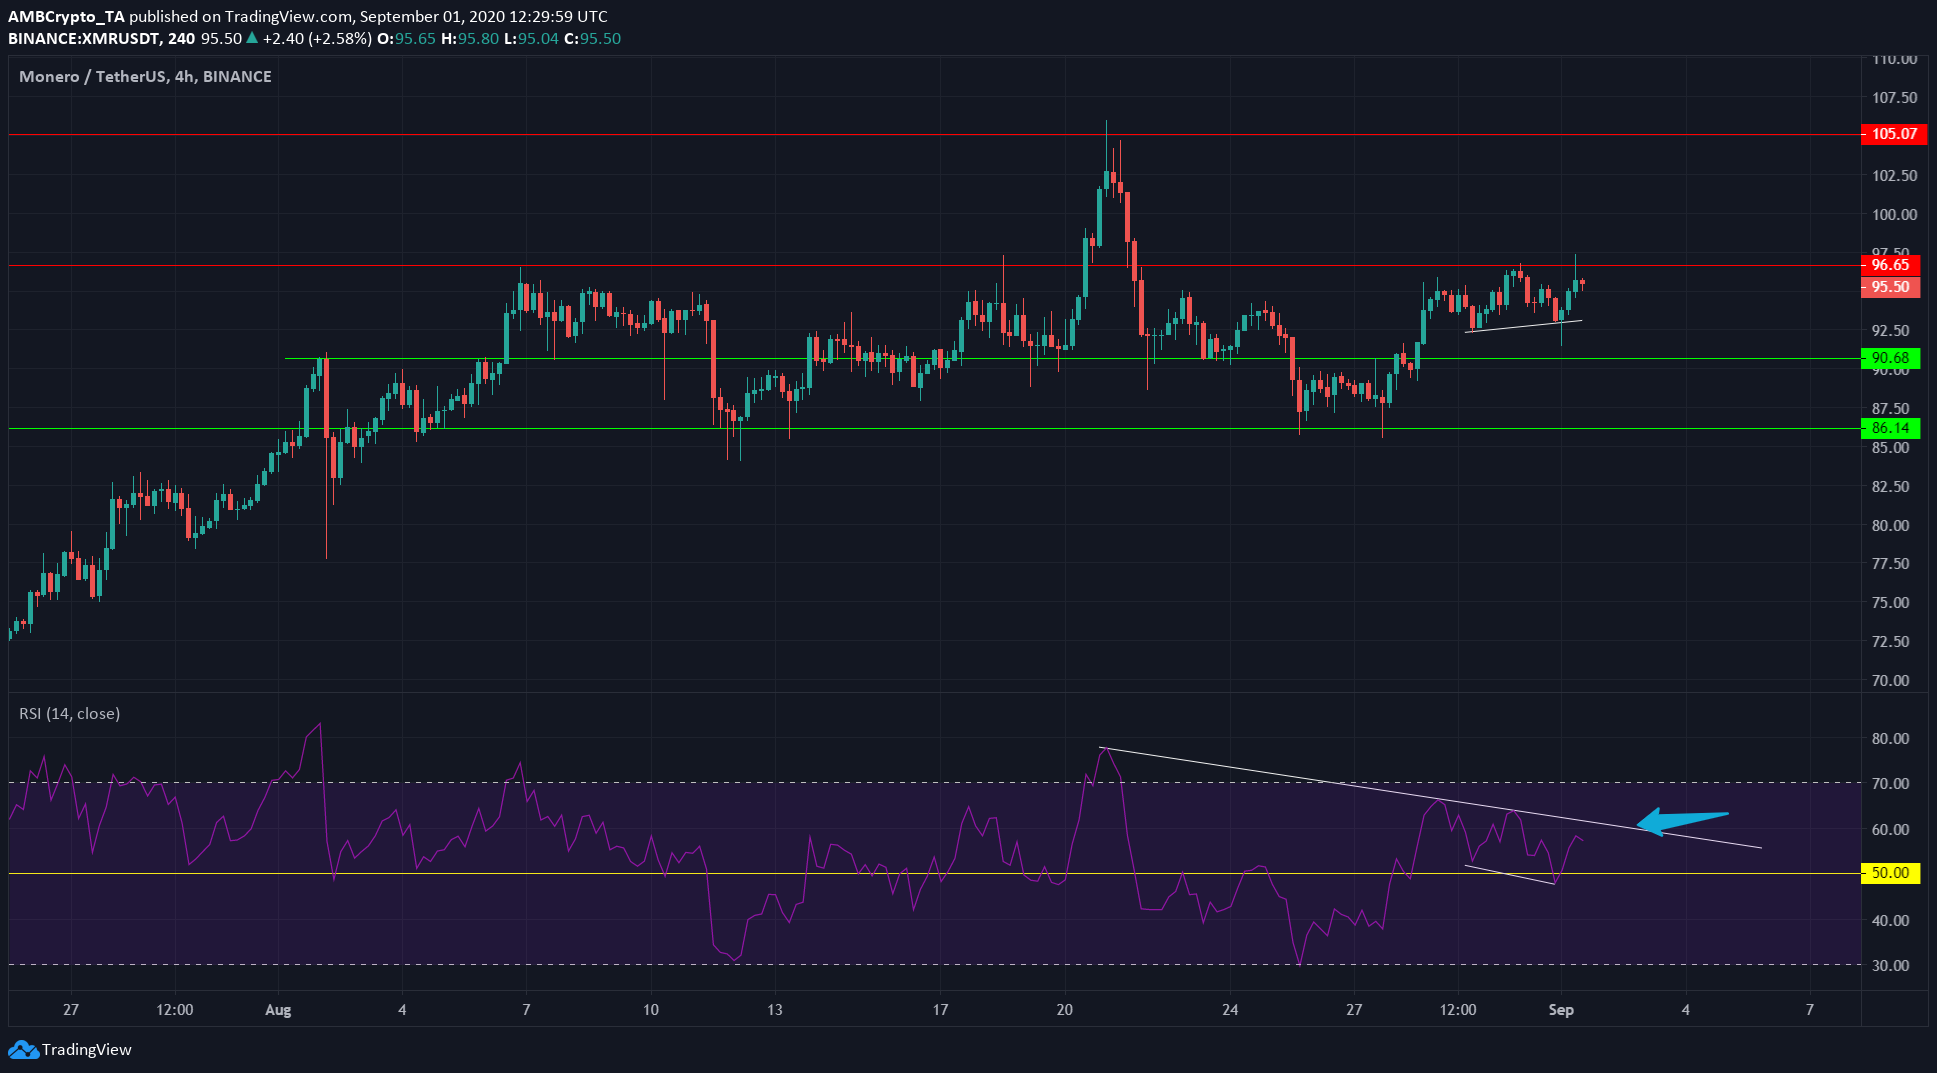
Monero showed a hidden bullish divergence that could play out in the next few hours. It is indicated by RSI making lower highs, while price made higher highs, as shown by the white trendline.
On a longer-term, the RSI readings of XMR has to break above the area marked with a blue arrow, to indicate a buy signal. If XMR reclaims resistance at $96.6 zone, this could occur.
The imminent level of support for XMR lies at $90.
Stellar Lumens [XLM]

Source: XLM/USD on TradingView
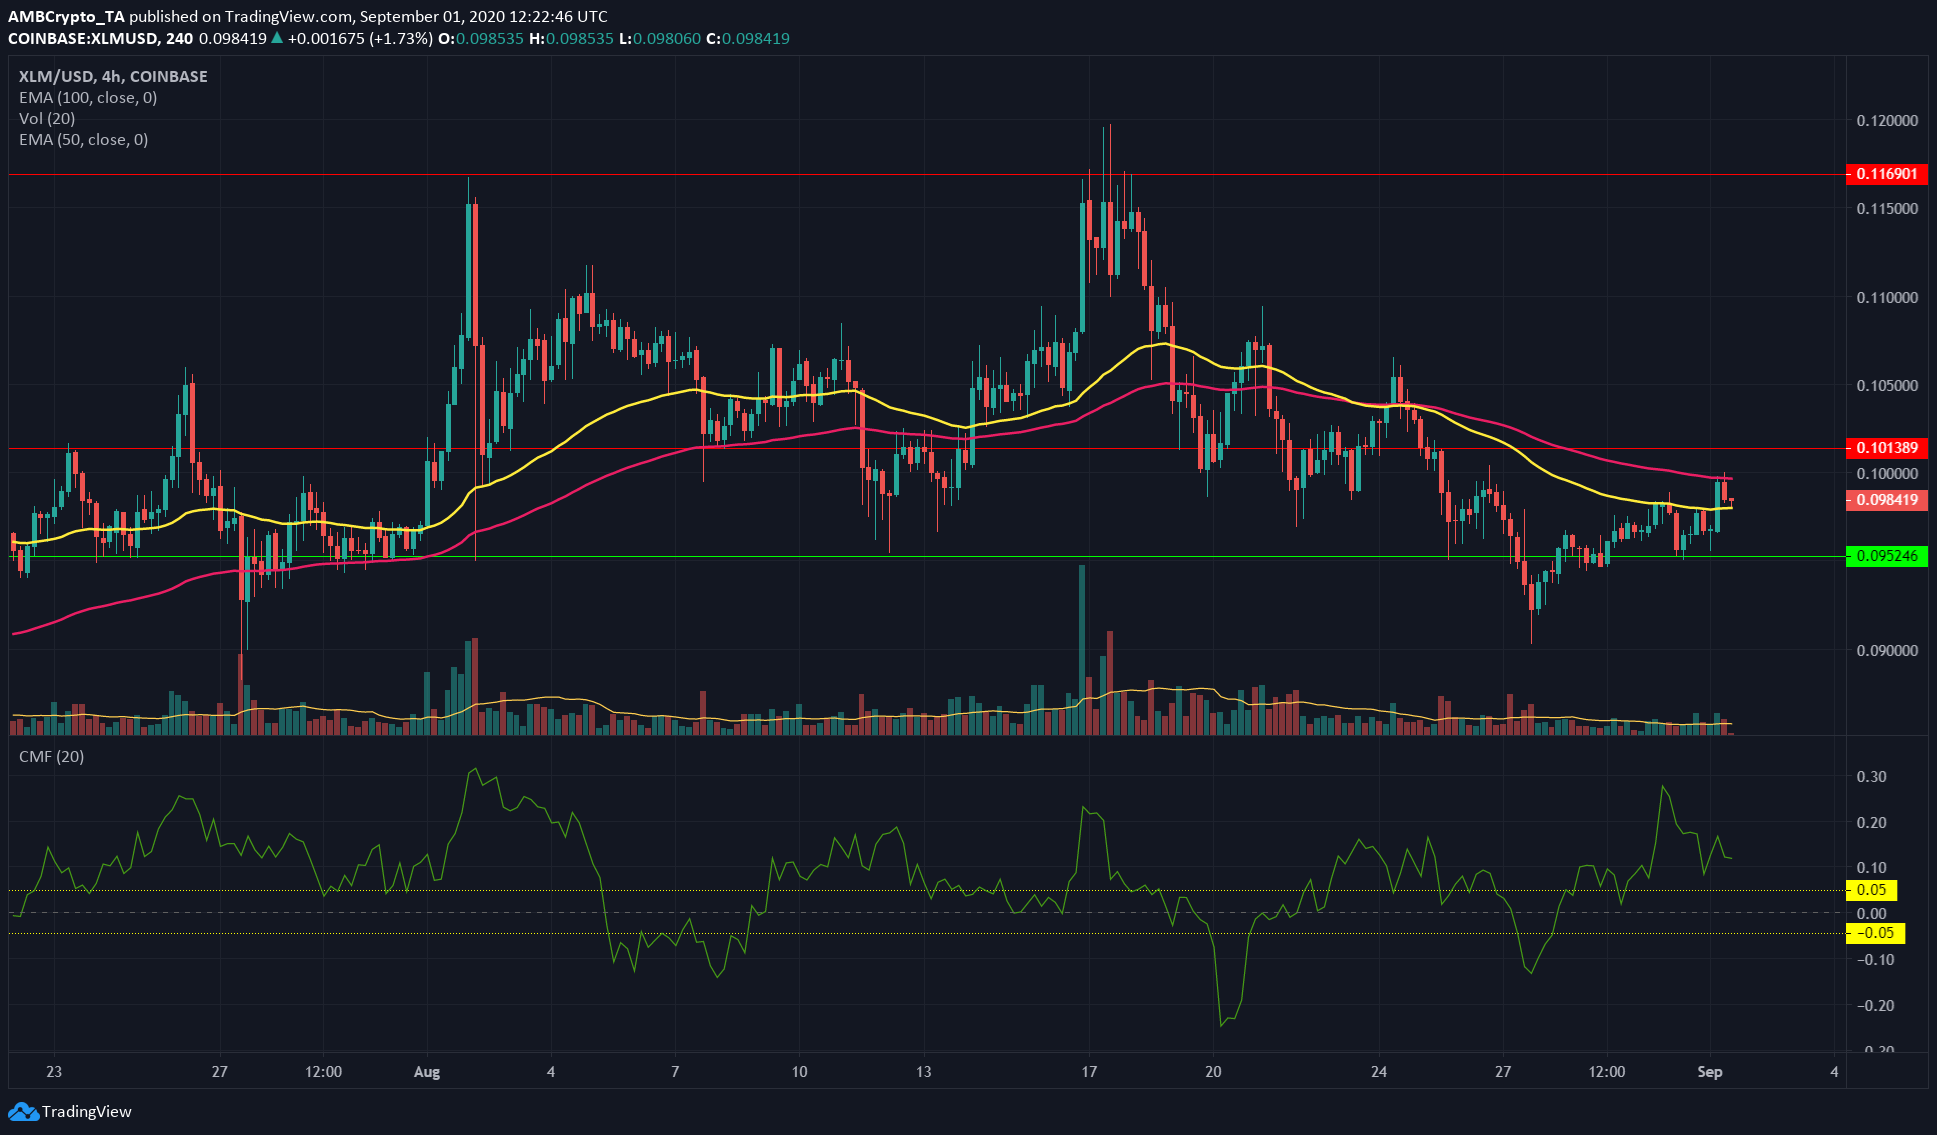
XLM showed bearishness as its 50 EMA (yellow) crossed beneath 100 EMA (pink). XLM also met resistance at the 100 EMA, and was rejected downward.
In contrast, CMF showed buyer interest still prevailed over sellers in the market, with a CMF value of +0.12. But the buying pressure was weakening, as it went as high as +0.28 a few sessions prior.
A support zone for XLM lies at $0.095.


