The bullish momentum present in the crypto market hasn’t always been uniformly present in many of the market’s altcoins. While many coins have surged in the past week, there have also been altcoins that continue to trade mostly sideways. For popular altcoins like Litecoin, Cosmos, and Tezos, while there have been slight spikes in price, the coins have stayed mostly range-bound.
Litecoin [LTC]

Source: LTC/USD, TradingView
Litecoin’s price has fallen by close to 5 percent in the past 24-hours and currently trades at $229.9. During the past week’s time, LTC failed to note any meaningful gains and saw its price appreciate by a marginal 1 percent. The coin currently trades between its resistance at $243 and support at $202 and if the coin fails to breach the resistance in the coming days, a further price dip can be expected.
The coin’s technical indicators, however, don’t paint a very bearish picture at the moment. The MACD indicator underwent a bullish crossover a while back and a reversal doesn’t seem imminent. The RSI indicator continues to remain in the overbought zone but signs of a reversal cannot be ignored.
Cosmos [ATOM]

Source: ATOM/USD, TradingView
Cosmos’ price rose by over 11 percent in the past 7 days’ time. However, its gains are soon disappearing as the coin is currently moving southwards. At press time, Cosmos was trading at $22.4 with a market cap of $4.7 billion. The coin failed to breach the resistance at $26 in the past few days and at the time of writing the price has retreated even lower towards the support at $20.
The EMA ribbons have settled below the coin’s trading price and offer support around the $18 price level. The MACD indicator looks a bit bearish as the signal line is now rising towards a free falling MACD line.
Tezos [XTZ]
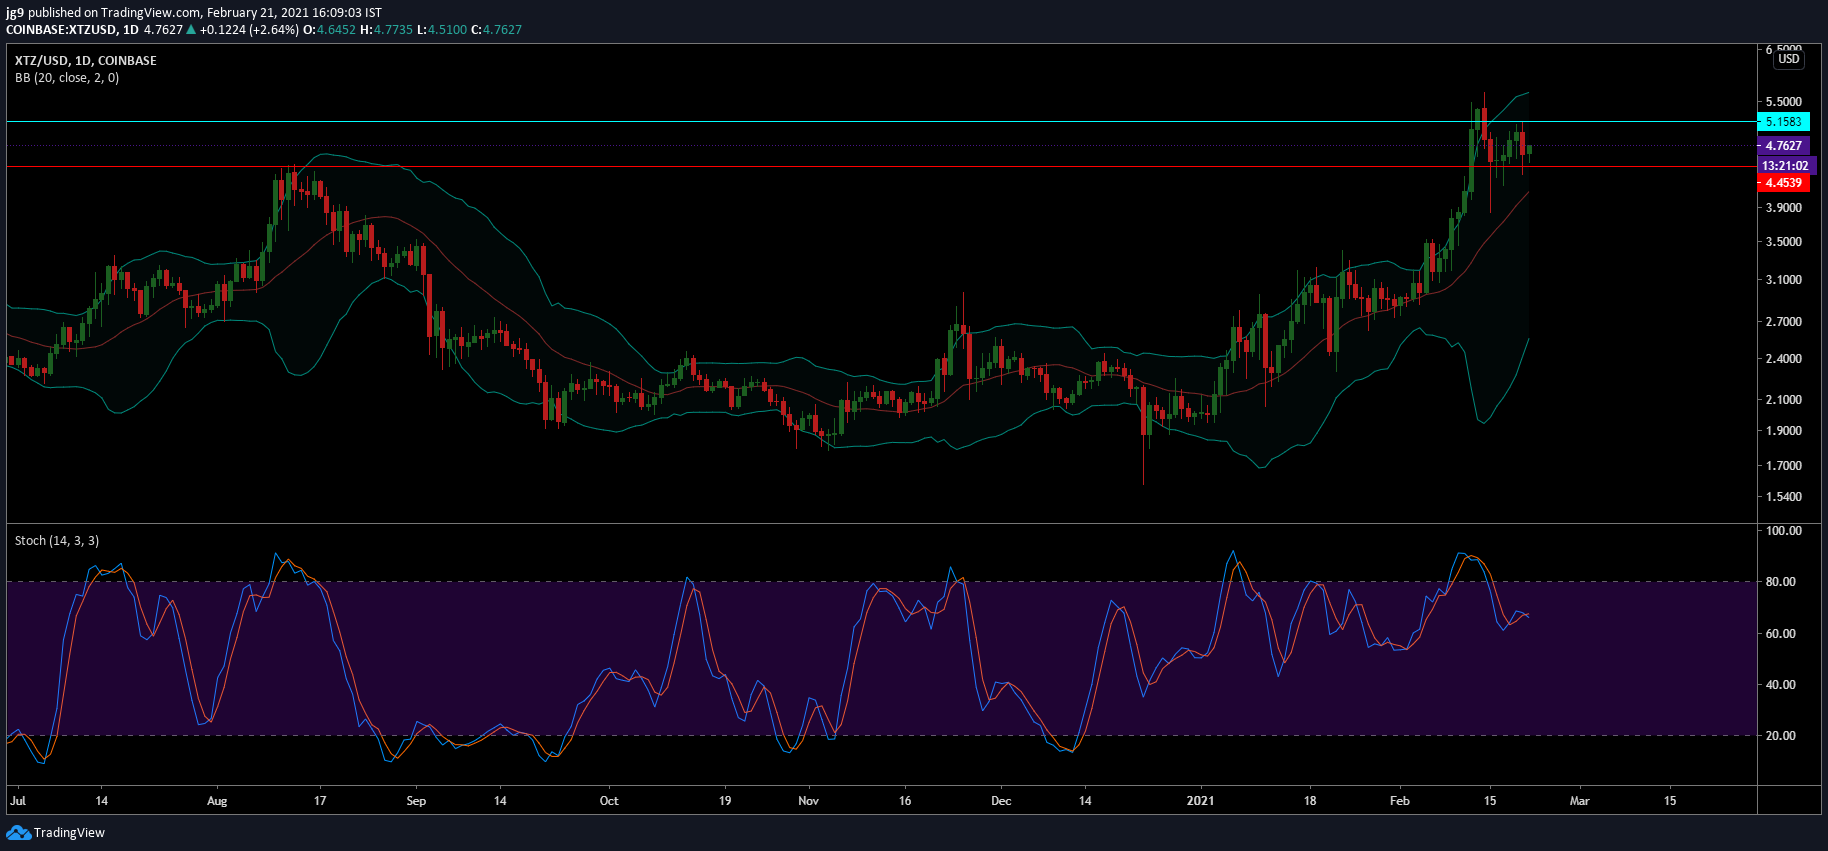
Source: XTZ/USD, TradingView
Tezos came close to registering a new ATH, however, in the past day’s time, much of that bullish momentum seems to have faded. The coin currently trades at $4.7 and has a strong resistance level at the $5.1 price point. The coin is now close to its immediate support at $4.4 – a range that has been tried and tested multiple times in the past week.
The coin’s Stochastic indicator is heading away from the overbought zone and is closer to the neutral zone at the time of writing. The Bollinger Bands are far apart and indicate high volatility in XTZ’s price charts.
![Reasons why Litecoin [LTC] investors should be concerned](https://eng.ambcrypto.com/wp-content/uploads/2023/12/ambcrypto_A_Litecoin-themed_scen-400x240.png)