Monero, Ethereum Classic, Verge Price Analysis: 27 February

Monero could break north from its horizontal channel and trade closer to the $250-mark in the near term. Ethereum Classic could retest its $12.4-resistance level after a bullish twin peak formed on the Awesome Oscillator. Finally, Verge was projected to move within a fixed channel as volatility was falling across its market
Monero [XMR]

Source: XMR/USD on TradingView
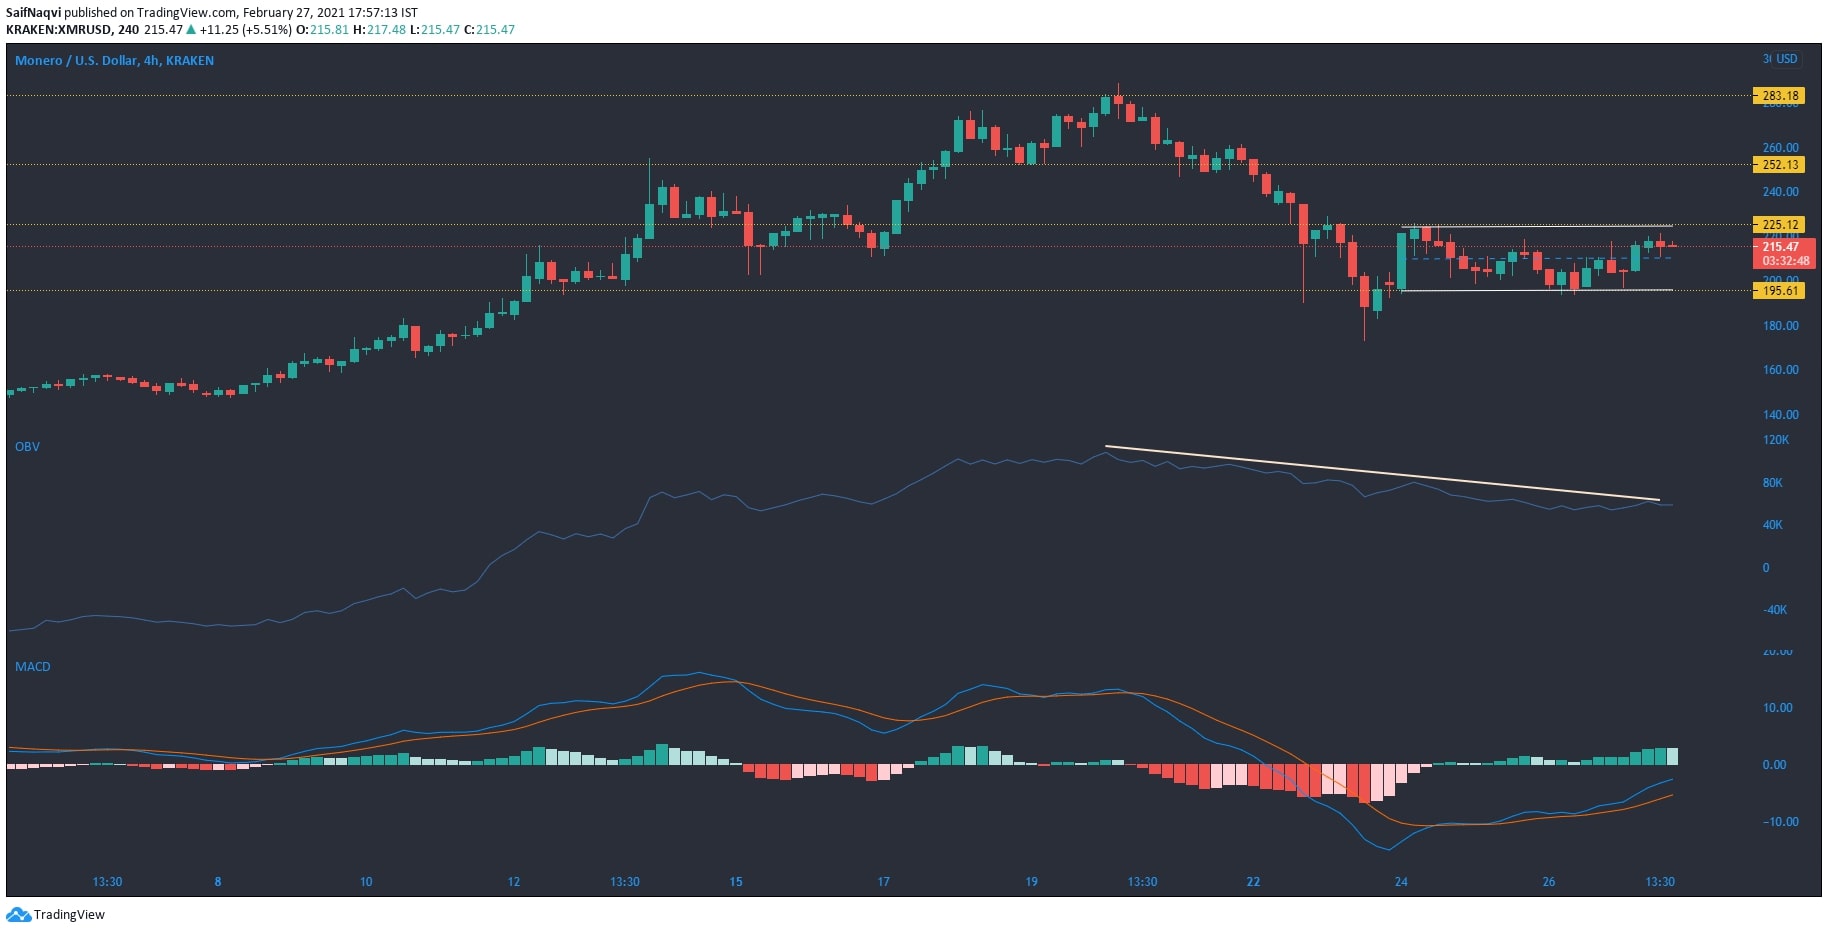
Monero registered strong oscillatory movement between $225.12 and $195.6 over the last few sessions for a horizontal parallel channel to be considered on its 4-hour charts. Even though the 24-hour trading volumes had ticked up, they were at noticeable levels at the time of writing. The OBV formed lower lows, highlighting the drop in buying pressure as XMR moved south from a local high of $283.18.
The MACD line moved above the Signal line, while the histogram noted rising bullish momentum. An upwards breakout could be on the cards and a spike in trading volumes could trigger the breakout.
Ethereum Classic [ETC]

Source: ETC/USD on TradingView
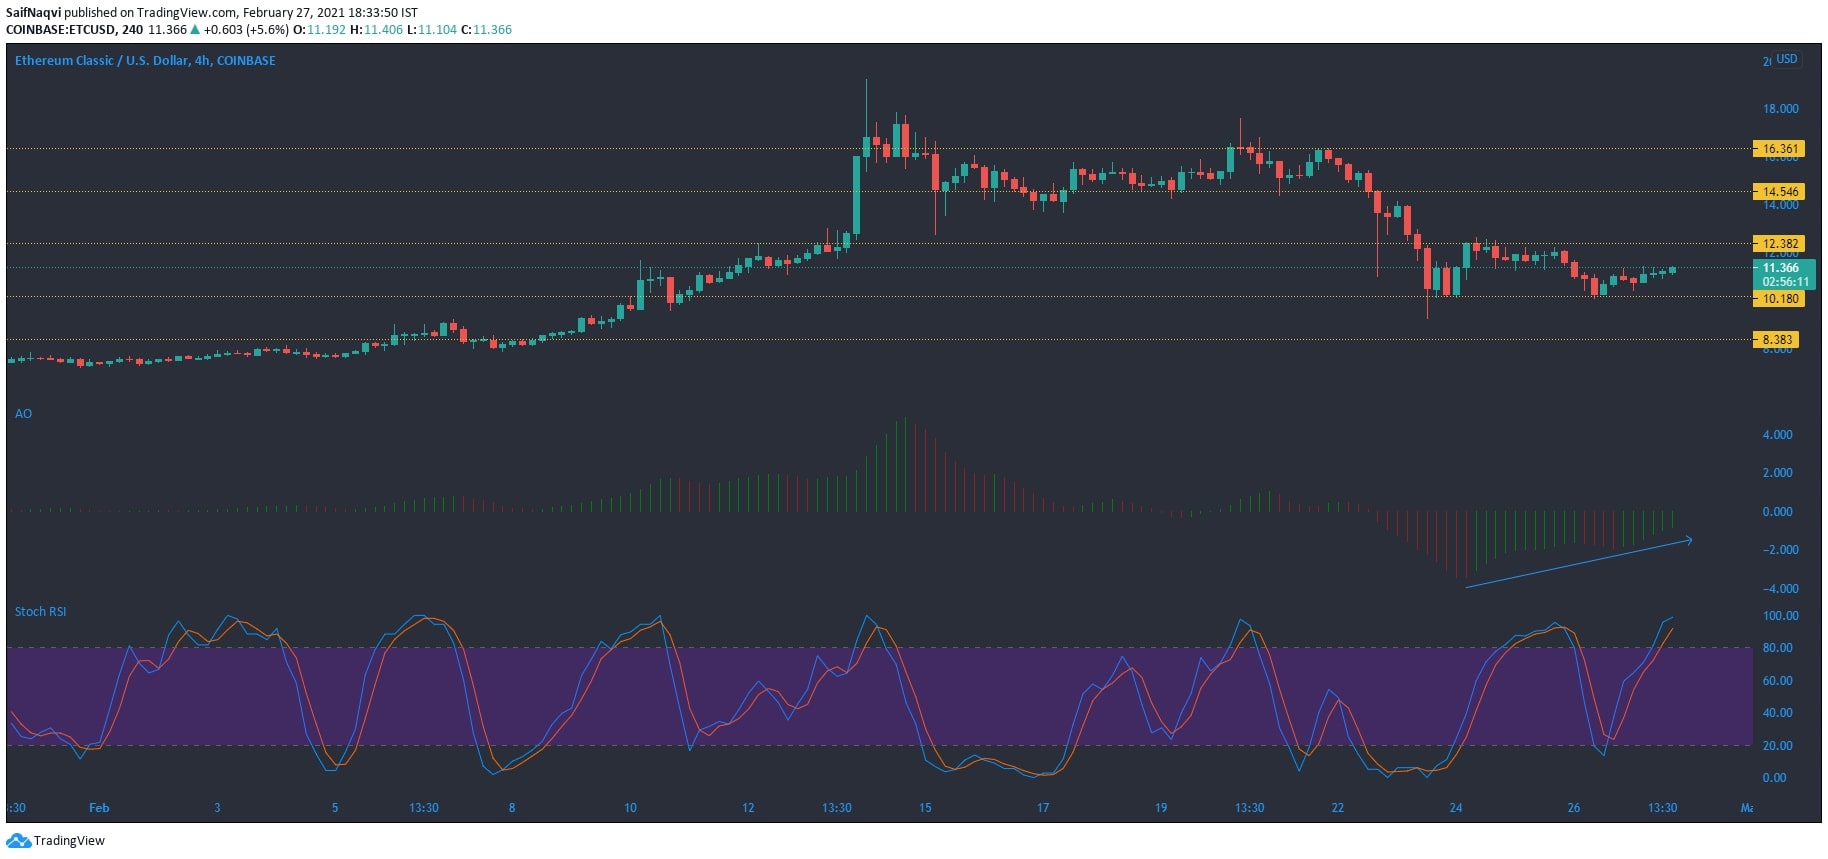
A bullish comeback from the $10.2-support was quickly negated after Ethereum Classic failed to flip the $12.4-resistance level. At the time of writing, Ethereum Classic was trading slightly above the $10-level, up by over 6% in the last 24 hours. The Awesome Oscillator formed a bullish twin peak set-up as the second peak was higher than the first. This lent weight to a northbound move as the market’s bulls attempted to test the aforementioned resistance level once again.
The said optimism was shut down by the Stochastic RSI, however, with the same peaking in the overbought zone. The bulls could hold the crypto’s price above the $10.2-support in the event of a minor pullback.
Verge [XVG]

Source: XVG/USD on TradingView
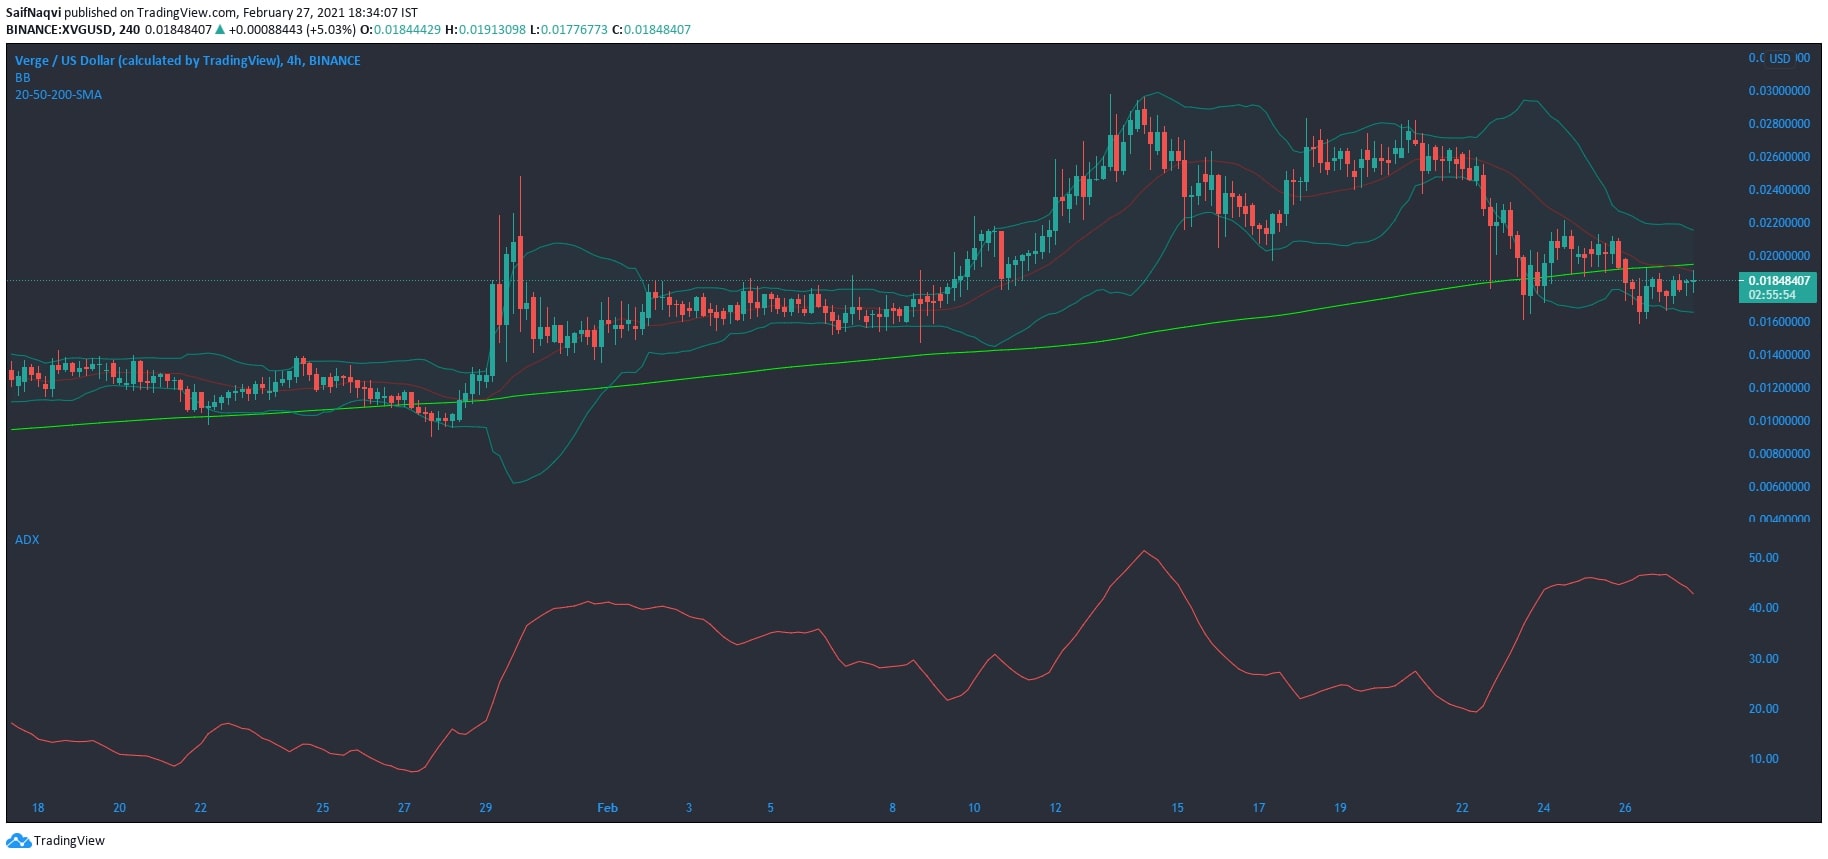
Bearish market movement was evident on Verge’s 4-hour charts as the price slipped below the 200-SMA. However, the ADX indicator was pointing south from the 45-mark, a finding highlighting that the downtrend was losing strength over the past few sessions. The Bollinger Bands also complied with the ADX since volatility was falling after recent losses were cut short at $0.0166.
A period of consolidation would see the price move between $0.02 and $0.0166 and stronger cues would be needed for a rise above the long-term moving average.


