Bitcoin

Bitcoiners get bullish after witnessing a fractal, but hope may be a dangerous thing
Posted:

Bitcoin’s price, which was stuck in a limbo, is facing a tipping point. If the volume is high and the price continues to trend higher, the bulls are back in action. However, if the volume is not enough, BTC prices will face uncertainty, just as Schrodinger’s cat did.
In yesterday’s article, Bitcoin’s daily chart presented the prices stuck in a descending triangle. Today, the price is testing the declining resistance line; if it manages to break it, as mentioned above, it will be out of limbo and the bulls will begin to push the prices higher.
Before you turn into a critic, wait. There’s an explanation to all of this.
The Slightly Bigger Picture
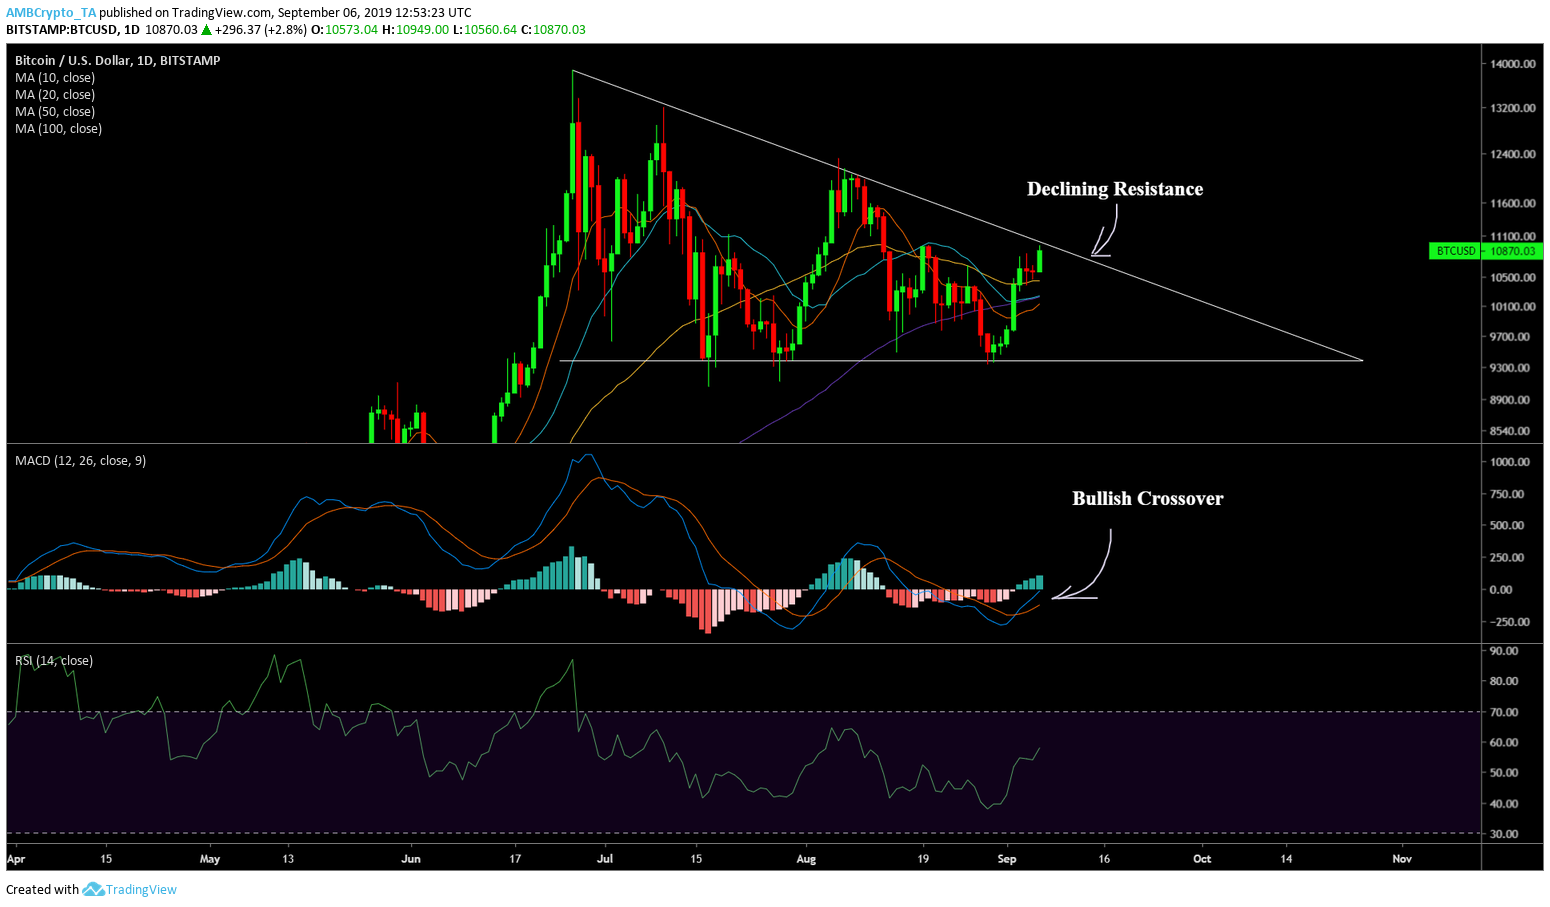
Source: TradingView
As seen in the above chart, the 10, 20, 50, and the 100 DMA are acting as support for Bitcoin and hence, this favors the bulls. This might cause the previously mentioned pattern to be invalidated if the price closes above the descending resistance line [aka hypotenuse of the descending triangle] for more than 2 candles.
Supporting this theory is the MACD indicator, whose signal and the MACD lines have traversed away from each other, indicating the strength of this bullish crossover. RSI is further quantifying this move as it keeps ascending higher.
Now that the ‘slightly bigger picture’ is put across, it is time to see how and if that scenario will ever come to fruition in the lower timeframes.
Lower Timeframe

Source: TradingView
In the 4-hour timeframe, the price of Bitcoin has entered into a consolidation zone, which happens to be a bullish continuation pattern – Bull Flag. Yes, a ‘Bull Flag’. The breakout from this has an inherent bullish bias to it, which means that the above-mentioned declining resistance will be tested when the price breaks out of this continuation pattern.
Stochastic RSI offers some resistance and suggests that it is about to take a u-turn and head back down. The crossover for Stochastic RSI has already occurred.
The Critics’ Section
There have been fractal sightings on crypto-twitter by a couple of traders, whose charts are all indicating a bullish launch pretty soon.
$btc Looks like it wants to continue higher this weekend. pic.twitter.com/cBiO4YIrH8
— fil₿fil₿ (@filbfilb) September 6, 2019
Fractals seem to hold up and BTC prices have, more often than not, formed similar patterns and stuck by them. However, Mark Twain said it best,
“History doesn’t repeat itself but it often rhymes.”
So, beware and DYOR.
TARGETS
Bitcoin has a clear advantage to strike; $11,000 and even go as high as $11,100 in the next 24 hours.
If the price continues to go higher, it might reach $11,250, but not beyond that in the next 48 hours.
All of the above is if the price continues on its bullish bias.
However, if that is to fail, the price will trend down to $10,700 or $10,600. This will cause it to be further confined in the bull flag mentioned above, at least until it breaks out of it.


