
Disclaimer: The findings of the following analysis are the sole opinion of the writer and should not be taken as investment advice
A recent re-test of the $17,610-level led to the perma-bears in the market rearing their heads with interest. However, to their disappointment, Bitcoin jumped back above $18,000 and it has maintained a position above that level since. While its press time price of $18,300 was fueling some uncertainty, based on momentum, another bullish leg seemed the most likely outcome.
Bitcoin 1-hour chart

Source: BTC/USD on TradingView
The attached chart should excite Bitcoin hodlers in the current market. At press time, Bitcoin was under the last few resistance levels it would have to breach before attaining its all-time high valuation. Beyond that, Bitcoin hasn’t seen a day of trading. Yesterday, when Bitcoin’s value dropped, it went under the 50-Moving Average and there was some southbound retracement. However, in the few hours before press time, the crypto-asset had managed to attain a position above the moving average yet again.
The trading volume has remained consistent, not really high, but enough to keep the market tick. While no patterns were identified, it should be noted that Bitcoin didn’t seem to abide by any on the short-term charts. Simply put, its volatility and price performance were outperforming every resistance level.
Market Rationale
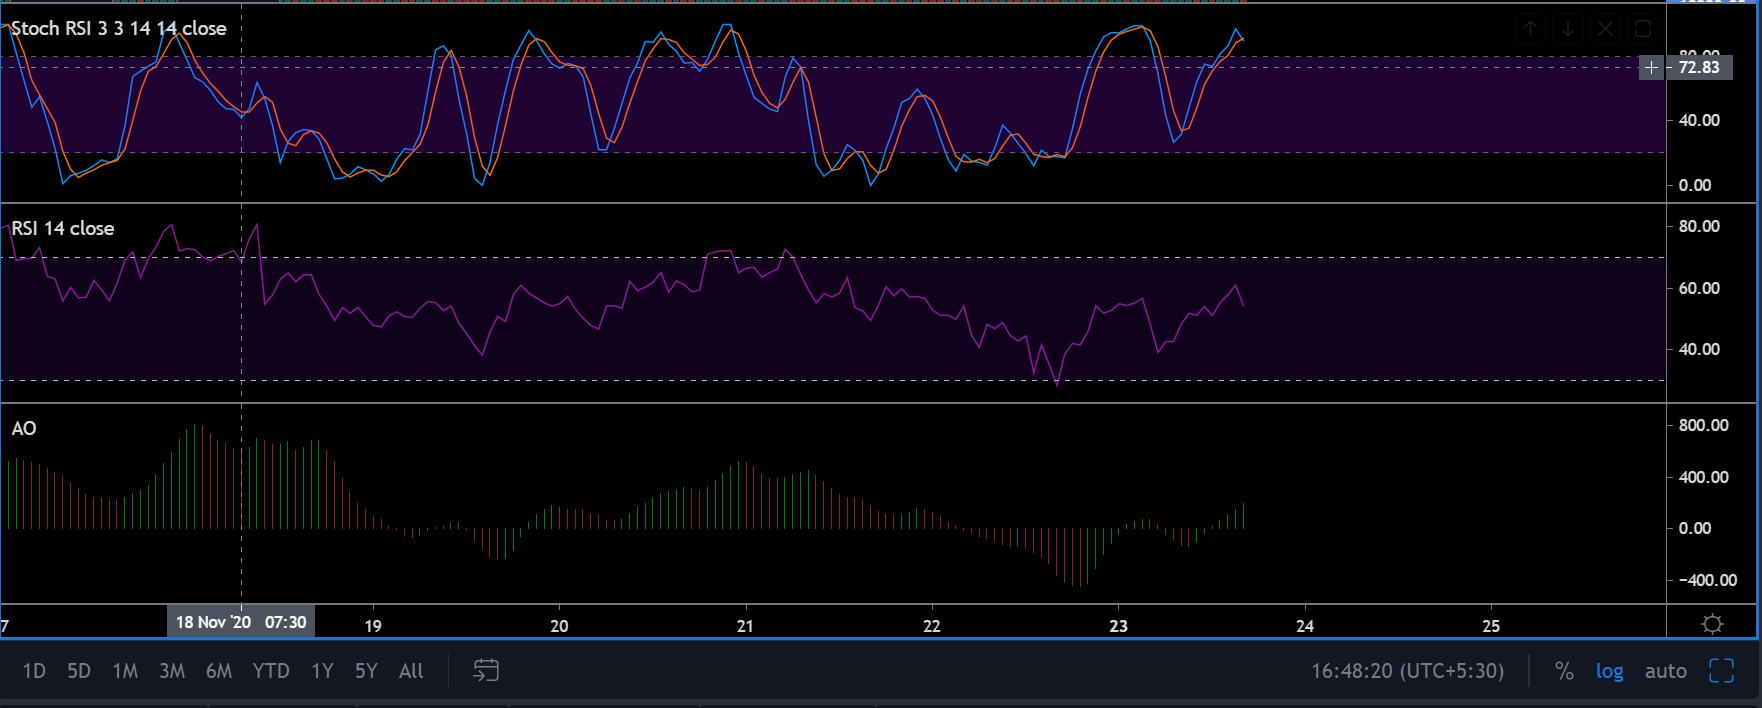
Source: BTC/USD on TradingView
The Stochastic RSI pointed to a minor pullback at press time as the blue line crossed the orange line on the charts. With the Relative Strength Index or RSI still under the overbought zone, a price hike remained a possible outcome after it reverses its recent price dips.
Finally, the Awesome Oscillator or AO pointed to a slow build in bullish momentum for Bitcoin, the only outright bullish indicator.
Important Range
Resistance: $19350, $19890
Support: $18000, $17610
Entry Position for Long Position: $18500
Stop Loss: $18150
Take Profit: $19350
Conclusion
Bitcoin is really close to its all-time high valuation. While the market is due for a correction as we speak, the undeniable rally continues to nullify all analysis. It is still possible for Bitcoin to undergo a reversal from this point, but the resistance at $19,350 will possibly be tested over the next few days.