Disclaimer: The findings of the following article are the sole opinions of the writer and should not be taken as investment advice
Bitcoin, the world’s largest cryptocurrency, briefly tested the $18,500-mark again on 5 December as the king coin continued to consolidate higher up the charts. While the recent collapse down to $16,200 on 26 November was a warning sign, over the short-term, the price may attain another re-test at a yearly high of $19,915, before retracing down the charts again.
Bitcoin 1-hour chart
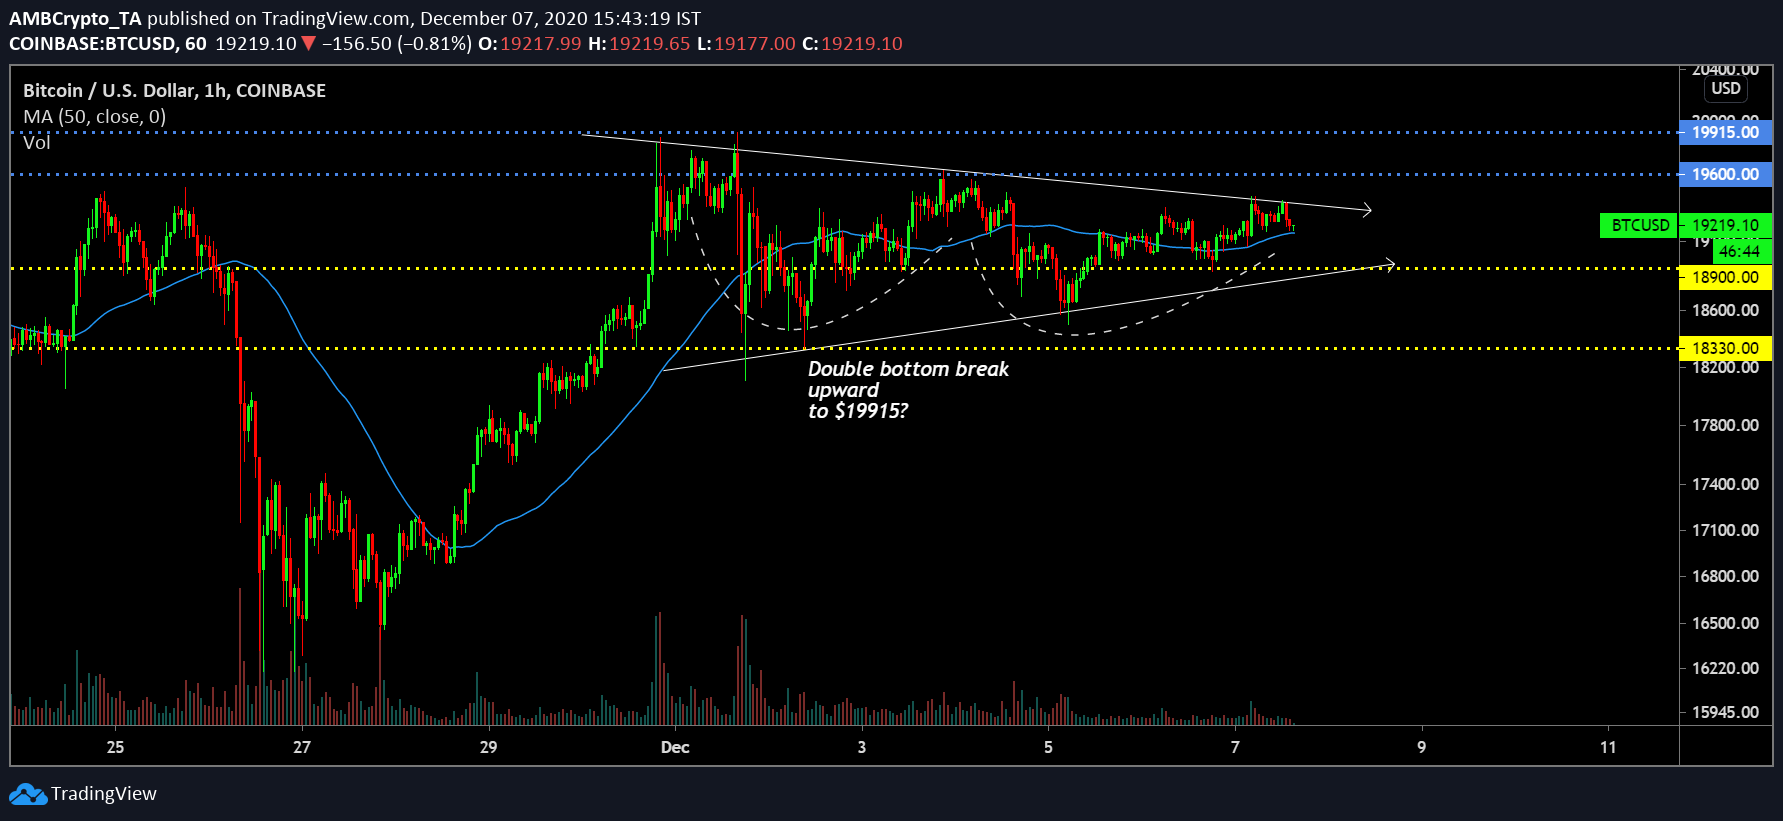
Source: BTC/USD on TradingView
The 1-hour chart for Bitcoin can be broken down into two parts. As can be observed from the charts, the price was facilitating oscillation under a symmetrical triangle. However, structurally, a minor double bottom can also be observed, one that can improve the chances of a bullish rally following the symmetrical pattern breakout. A move upwards would directly allow BTC to possibly take a stronger position above $19,600.
Further, the trading volume has remained extremely minimal, pointing to a decrease in BTC’s hype rally while the 50-Moving Average continued to hover under the price candles on the charts.
Market Reasoning
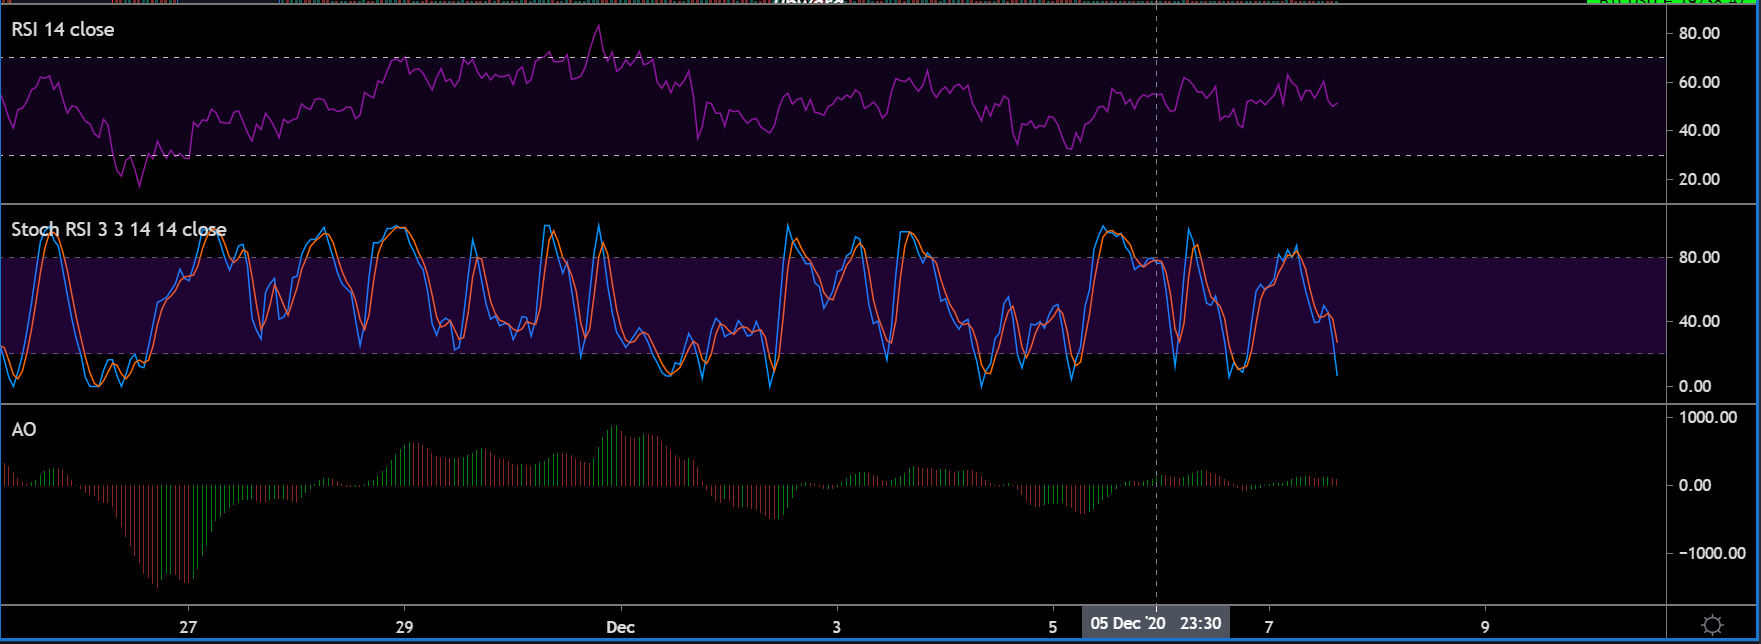
Source: BTC/USD on TradingView
Bitcoin’s market indicators were not outrightly bullish, but the sentiment was positive. According to the Stochastic RSI, a positive reversal may take place as the bullish line dropped down to an oversold position, lagging well under the bearish line.
Also, while the Awesome Oscillator did not point to any rising momentum with the bulls/bears remaining at bay, the Relative Strength Index underlined a minor uptick, one implying a return of the buyers after the shake off on 5 December.
Important Ranges
Resistance: $19600, $19915
Support: $18900, $18330
The trend is a little volatile to leverage a long or short trade.
Conclusion
In light of the chart speaking volumes on the question of reversing the current short downtrend, Bitcoin may re-take the resistance level at $19,600. However, following the short-term hike, the long-term outlook may remain uncertain as BTC is due for a correction on the price charts.