
Disclaimer: The findings of the following article are the sole opinion of the writer and should not be taken as investment advice
Bitcoin has started its rollercoaster ride yet again. This has contributed to longs worth billions being liquidated as a result. As long as we have high volatility, we can expect this trend to continue with Bitcoin.
At press time, Bitcoin was trading at $18,100, having recorded a 5.4% surge over the last 24 hours and a -3.3% fall over the previous week. Here, it was obvious, therefore, that the weekly timeframe would look bloody due to last week’s price drop.
However, even after the drop, Bitcoin’s price has started to surge almost in a parabolic fashion. Often, parabolic surges end up with a 60% to 70% retracement, with the same seen in last week’s drop too. The recuperation rally might also witness something similar this week, but scaled down.
Bitcoin 1-hour chart
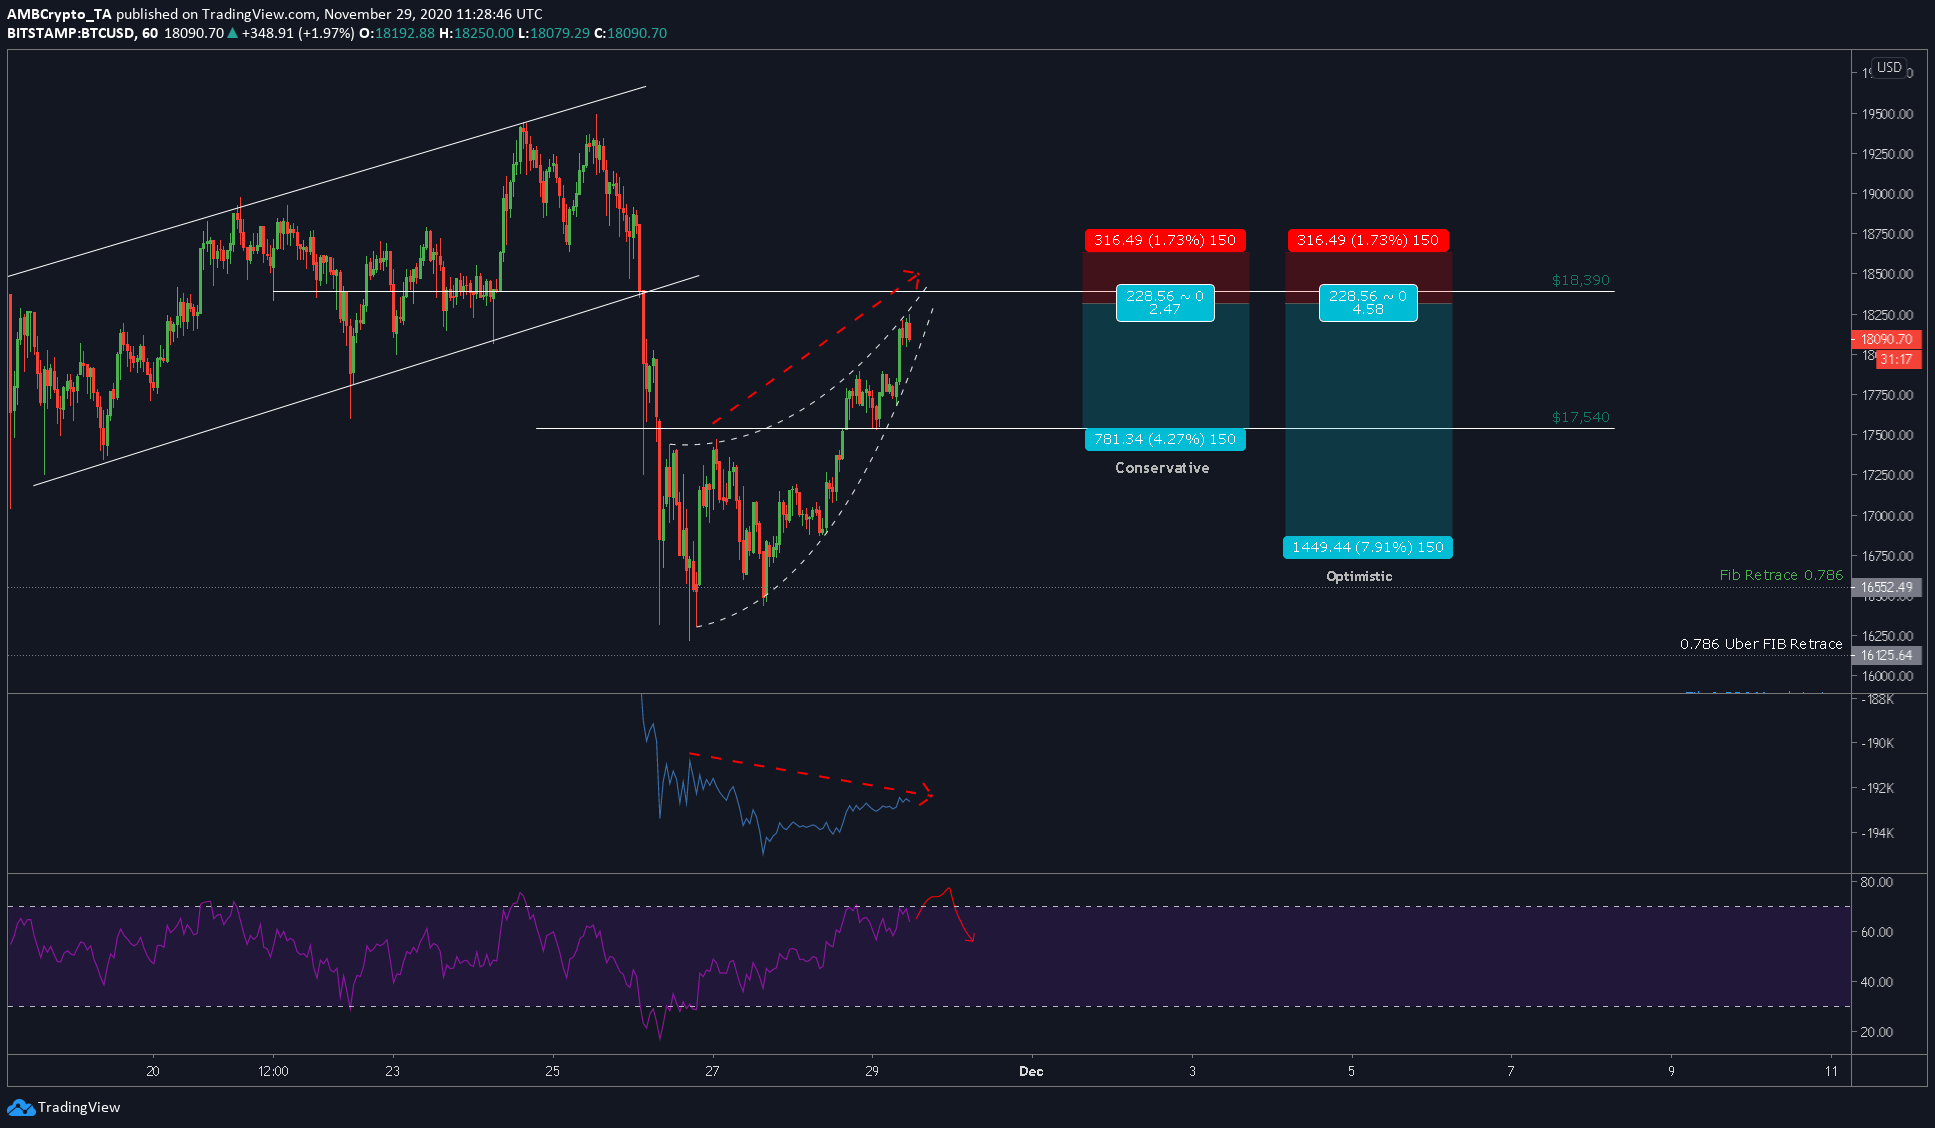
Source: BTCUSD on TradingView
The attached chart highlighted Bitcoin’s parabolic ascent after a drop to $16,200. BTC’s price has managed to hit $18,250 [10%] in just under 3 days. At $18,550, there is a wall of sellers waiting to dump Bitcoin. Hence, we can expect a drop after the price hits this level. Overall, the scenario seemed bearish for Bitcoin, something that calls for a short play.
Rationale
In addition to the sell wall at $18,500, the OBV indicator has been forming a bearish divergence with the price since 27 November. This bearish divergence of price and volume alone will be enough to pull the price down.
Additionally, the RSI indicator was close to hitting the overbought zone. Unlike on the higher timeframe, the momentum will not be enough to sustain the price in this range for a long time. So, we can expect a drop as soon as the price hits the overbought zone.
While not present on the chart, both the MACD and the Stochastic RSI indicated a potential bearish crossover soon.
Levels to look out for
Entry: $18319.26
Stop-loss: $18635.75
Take-profit: $17537.92, $16869.82
Risk-to-Reward: 2.47, 4.58