Bitcoin

Bitcoin prices float back into a larger bearish pattern, while indicating a bullish bias in the shorter term
Posted:

Bitcoin shows a bullish pattern formation, indicating a probable breakout to the upside in a shorter time frame. The price of Bitcoin, at press time, was $10,571, and it has been consolidating at this level since the start of September.
Bitcoin’s bull run seems to have become constricted after it hit a peak of $13,800 on June 26, 2019. The price has been consolidating ever since, trying to breakout. The interesting thing to watch out for is the direction of the breakout. So far, there are two obvious predictions; one faction believes that the consolidation is a continuation pattern and will continue trending higher, while the other faction believes that the consolidation pattern is a descending triangle and that the price might dip to as low as $8,100 in the near future.
As of now, there are two scenarios Bitcoin will face; a short-term scenario where there is a possibility of a bullish breakout and a medium-term scenario where the price is showing a bearish bias.
Short Term

Source: TradingView
As seen above, BTC prices have formed a bullish pennant indicating a possible bullish breakout on the shorter time frame of one hour. The pennant is seen to be preceded by a flag pole, which has a steep rise, further confirming the pattern.
The breakout that will happen will still be inside the descending triangle pattern formed on a larger timeframe, as seen in previous articles.
The MACD indicator shows a failed bullish crossover. If this continues and the MACD lines cross below the zero lines, the breakout to the upside will be invalidated.
Target
As seen in the above chart, the price after breakout could hit $11,000.
Medium Term
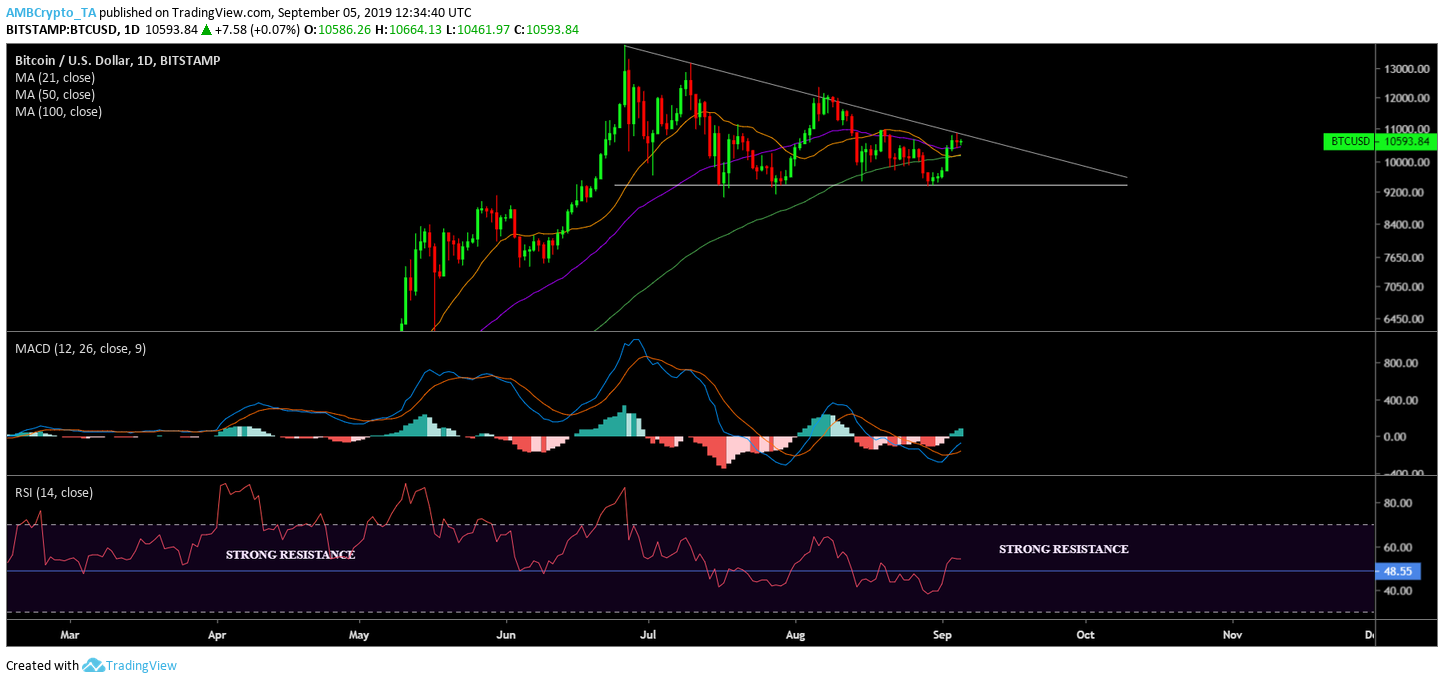
Source: TradingView
The daily chart for BTC shows a bearish scenario as seen in the above chart. The chances of price breaking to the bottom are slightly higher. The 21, 50 and the 100-DMA are acting as supports to the price, preventing it from collapsing further below. Looking closely at the charts, it seems like the price will undergo a few more bounces [2 to 3] in the next few days before the pattern is breached, which might happen in 2 to 3 weeks.
However, opposing the bearish scenario is the MACD indicator which shows a bullish crossover, which is still below the zero-line. This could be indicating the upcoming bounce, as mentioned above.
RSI is looking like it has peaked, considering the strong resistance it breached recently. This indicates a bounce to the bottom after hitting the $11,000 mentioned on the short-term chart.
Target
The price will bounce to $11,000 and possibly retrace back to somewhere between $10,400 and $10,300.
Conclusion
Short Term
$10,900 to $11,000
Medium Term
$10,400 to $10,300


