Bitcoin

A contrarian look at Bitcoin’s price may highlight probable scenarios for the future
Posted:

Crypto Twitter is teeming with analysts and price prediction gurus, with so-called experts running paid groups, selling lessons, and promising accurate predictions. How much of it is true? Can one really predict the price of Bitcoin?
Bulls v. The Matador

Source: TradingView
The current perception around Bitcoin is that the world’s largest cryptocurrency is bullish, with everyone hoping that the next run-up will be a major one. The correction phase is being regarded as something insignificant, a breather between bull runs. However, when push comes to shove, the cryptocurrency bulls might still have an ace up their sleeves. The hopes of a higher high rely solely on Bitcoin being able to breach the $13,800 level [which is also the 0.618-fib level] and its bullish momentum.
Given below are different scenarios which suggest that the bulls might just pull through.
The Three-Day Chart

Source: TradingView
The three-day chart, although not used often, makes an interesting finding by indicating a bull run – The 3-day Golden Crossover
A Golden Cross indicates the start of a bull run and the Death Cross indicates its converse, the bear run. The last time Bitcoin saw a Death Cross on a 3-day chart was on November 12, 2018, the day when BTC hemorrhaged to $3,122, the so-called Bitcoin bottom.
In contrast, the golden crossover was a spot-on indicator for the start of the 2016 bull run. It was formed on January 28, 2016, swiftly followed by a bull run that was supported by the 50-day moving average.
An analysis of the current state of Bitcoin suggests that there might be a Golden Crossover in the works. Although obscure, if the same pans out, the bulls are in for a treat.
The Bullish Elliot Wave Theory
As mentioned above, the bullish community is largely dismissive of the present correction. Several analysts and paid group leaders are of the belief that according to their Elliot Wave Theories, Bitcoin might shatter previous highs of $20,000, even crossing $50,000 by the end of 2020.
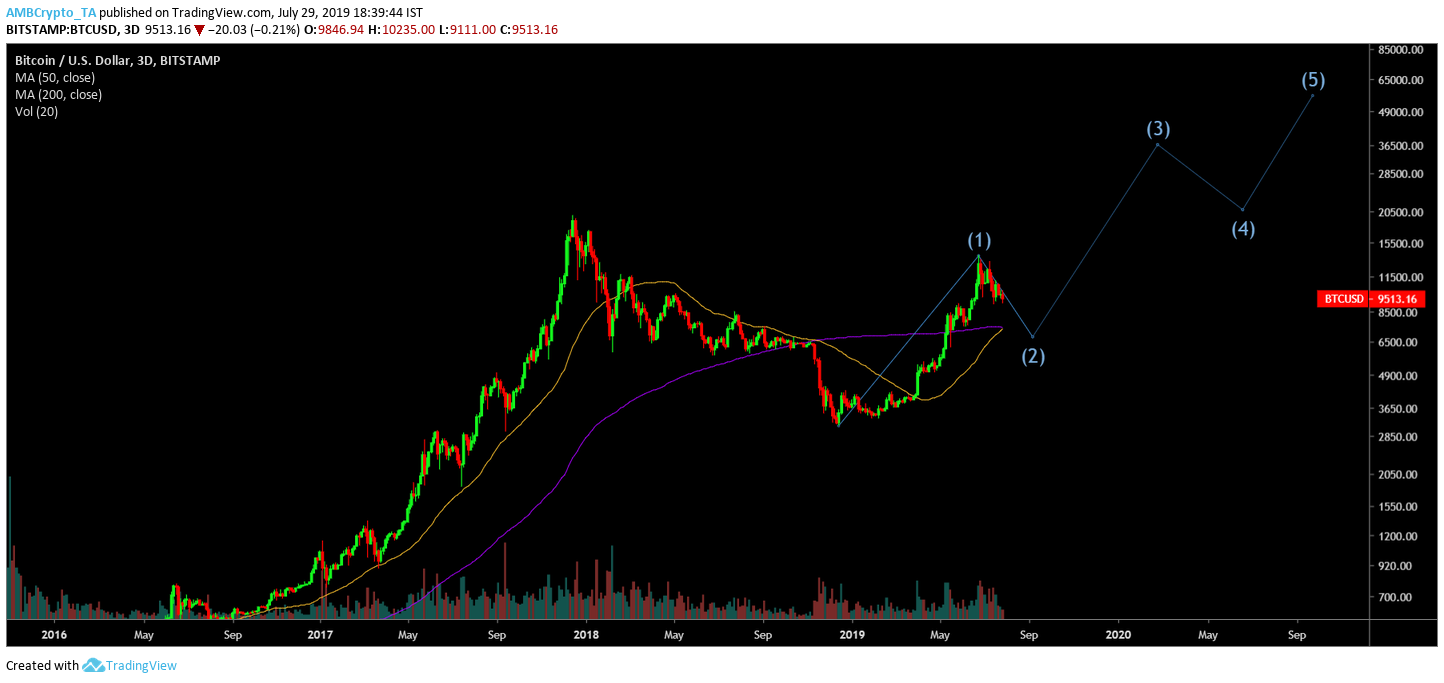
Source: TradingView
The above chart further clarifies why the bullish faction is taking this correction so lightly.
The East has a lot of philosophical teachings about how to reform oneself from the inside, about achieving inner peace. However, there is one important teaching that is familiar to both the East and the West, which is that expectations may sometimes lead to disappointment.
Enter Contrarian Theory
According to Humphrey B. Neil, author of The Art of Contrary Thinking, “when everybody thinks alike, everybody is likely to be wrong.”
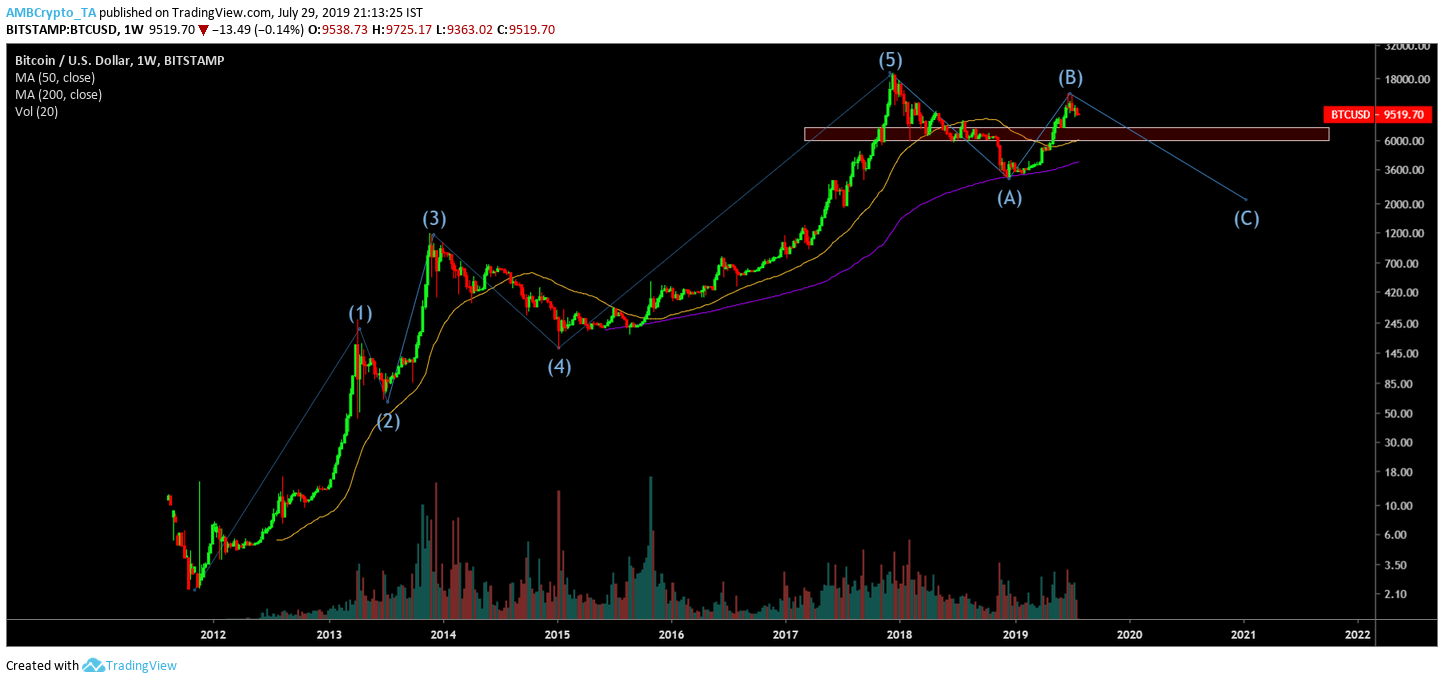
Source: TradingView
Supporting the contrarian view are two theories; the Bearish Elliot Wave Theory and the CME gap theory. The former suggests that Bitcoin is heading to lows that will shake out weaker hands and cause major capitulation. According to this, there is massive support at $7,500 – $6,000, and breaching this would be like a breach in the hull of the Titanic, causing everything to sink. The bearish momentum will push the price down to levels last seen during December 2018.
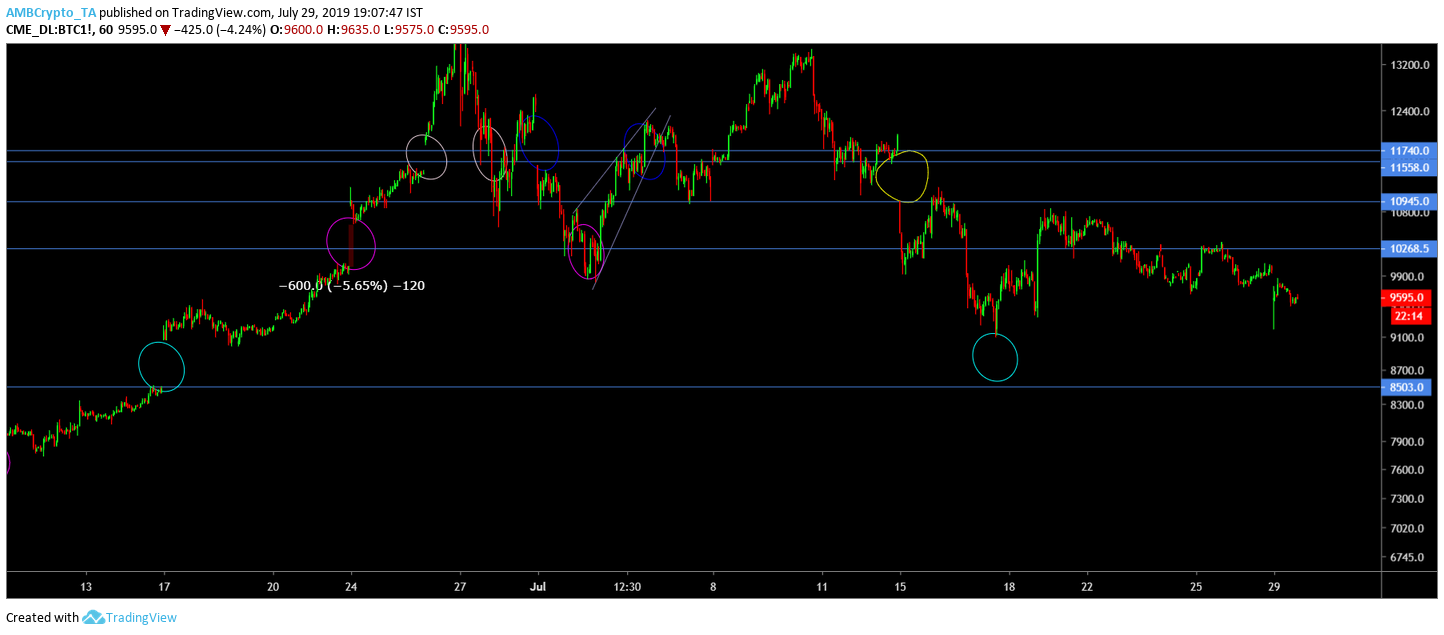
Source: TradingView
The CME chart for Bitcoin, which has a gaping hole from $8,500 to $9,000, is long overdue for the spot prices to fill. Following the same, the price will face the above-mentioned resistance. This might seem like a stretch, however, supporting the downfall of the domino is the death cross which is being lined up for Bitcoin.
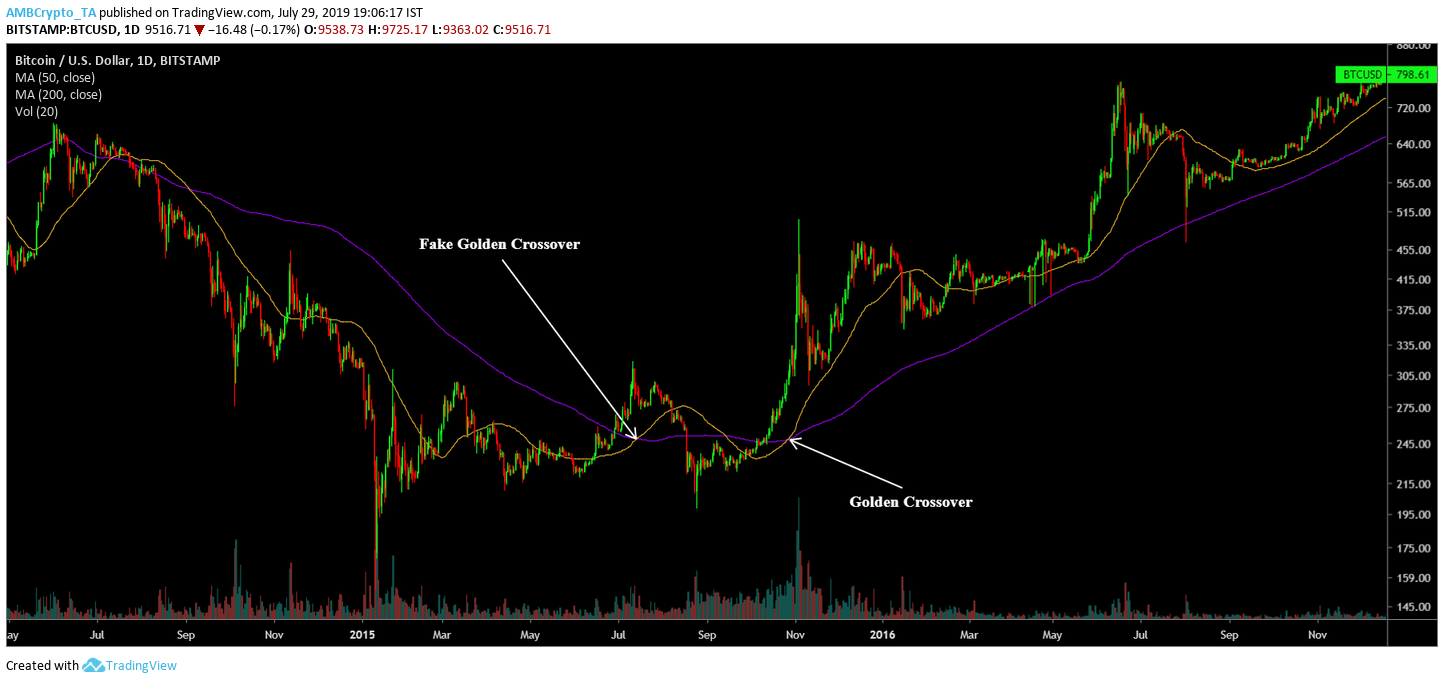
Source: TradingView
As seen in the chart above, there was a Golden Cross back in July 2015, which people expected to be the start of a bull run. The prices rose dramatically after this crossover for a brief moment, followed by a correction that proved that the crossover was nothing but a fakeout. The actual golden crossover took place on October 27, 2015, which led to the bull run.
Betting on Probability
There are two scenarios and the likelihood of them playing out are equal. There is no predicting how the price will move, no indicator that will reveal a definite direction in which Bitcoin or any other asset will move. Although the price is based on human emotions on a macro-scale and the charts are fractals repeating on different time scales, it is still not possible to accurately predict, with zero room for doubt, the direction and the target for any asset.
The same is true for Bitcoin. Anyone who tells anybody otherwise is either lying or is foolishly optimistic. There are however probabilities which can make trading more bearable, and the probability of Bitcoin moving lower seems far more likely.