
The previous year had been ruthless to cryptocurrencies, however, this year has been all about recovering from the bear’s attack for most coins but one. XRP’s adoption spree is evident, but that has not helped it break away from the continuous consolidation pattern the coin has been subjected to. As it goes through minor crests and troughs in the market, the community waits for the coin’s value to rise. The last peak for the coin was noted at $0.7961 on September 2018, after which the coin has been on a downward spiral.
After spiking by a whopping 196% in September 2018, XRP underwent its first freefall, where the price fell t0 $0.2729 on December 2018, registering a 65% drop. Since then, the coin has been on a roller-coaster ride, registering a recovery of 69% over 150 days, which was then followed by a fall of 46%. In the month of August, XRP peaked at $0.3481 and bottomed at $0.2394.
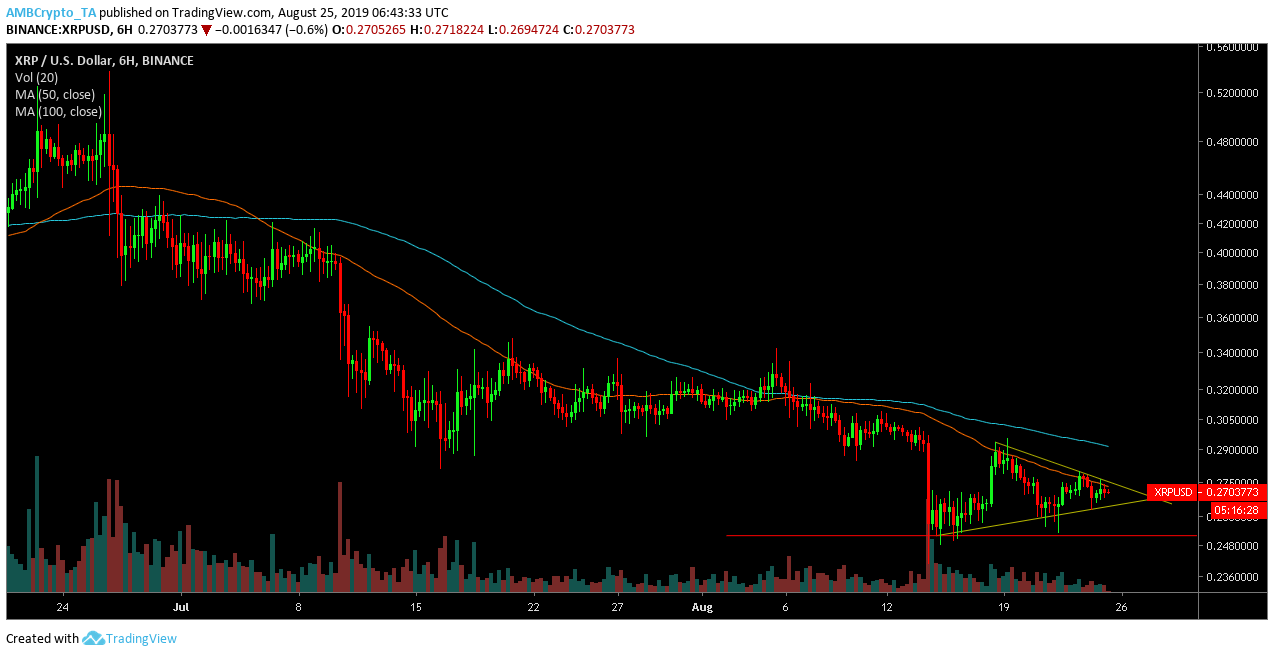
6-hour
Source: Trading view
The 6-hour chart indicated formation of a symmetrical triangle. The pattern is characterized by simultaneous downtrend and uptrend lines tapering. Consecutive downtrends can be observed from $0.2934, $0.2803, and $0.2761, while uptrends extended from $0.2522, $0.2597, and $0.263. The convergence of uptrends and downtrends form a point of breakout; however, with Symmetrical triangle, it is difficult to identify the direction of the breakout.
Looking at the moving 50-moving average line, it has been under the 100-moving average line for the past 50 days indicating a bearish trend. The 50-moving average line enjoyed its ride above the 100-moving average line for 12 days from June 22 to July 5, during which XRP reported a growth of 8.24%. However, since the crossover, the third-largest coin has been fighting the bears. Thus, if the price breaks out of the symmetrical triangle, it is might most likely to fall to $0.2519, where the immediate support lies.
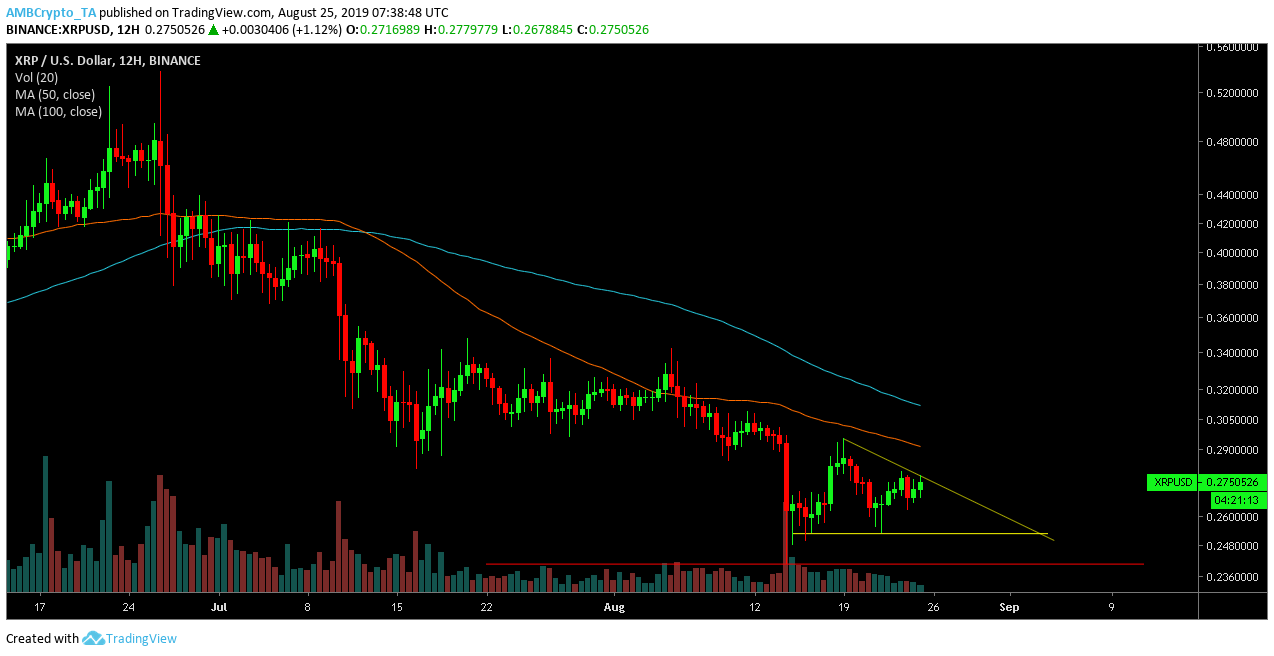
12-hour
Source: Trading view
The 12-hour chart of XRP pointed toward the formation of another bearish chart pattern- Descending triangle. The slope marks the series of lowers highs at $0.2952, $0.2800, and 0.2743, while the horizontal line connected a series of lows at $0.2534. The support for the coin stood at $ 0.2415.
As for the moving average line, the 50-moving average was under the 100-moving average, confirming a bearish reign. The 50-moving average has been under the 100-moving average for the past 43 days and noted a fall of 20.18%. Though the MACD line has taken over the signal line, XRP may note a minimal upward trend.
Another breach, another fall
The symmetrical triangle might result in a breakout towards another slump, as the moving average confirms the bear’s presence, while the descending triangle pattern awaits further consolidation. However, the coin might note a minimal rise in price between the trend lines, before it breaks out.