XRP’s price may suffer post ascending channel pattern breach

XRP was one of the most affected altcoin when the collective market went through a slump in September as its price depreciated to a yearly low of $0.2385. However, the altcoin was quick to recover and hasn’t fallen below $0.2500 despite being unable to breach $0.3000.
XRP was seen surging by 1.46% over the last 24-hours while the price of the third-largest cryptocurrency was at $0.2962, at press time.
XRP 1-day chart

Source – XRP/USD on Trading View
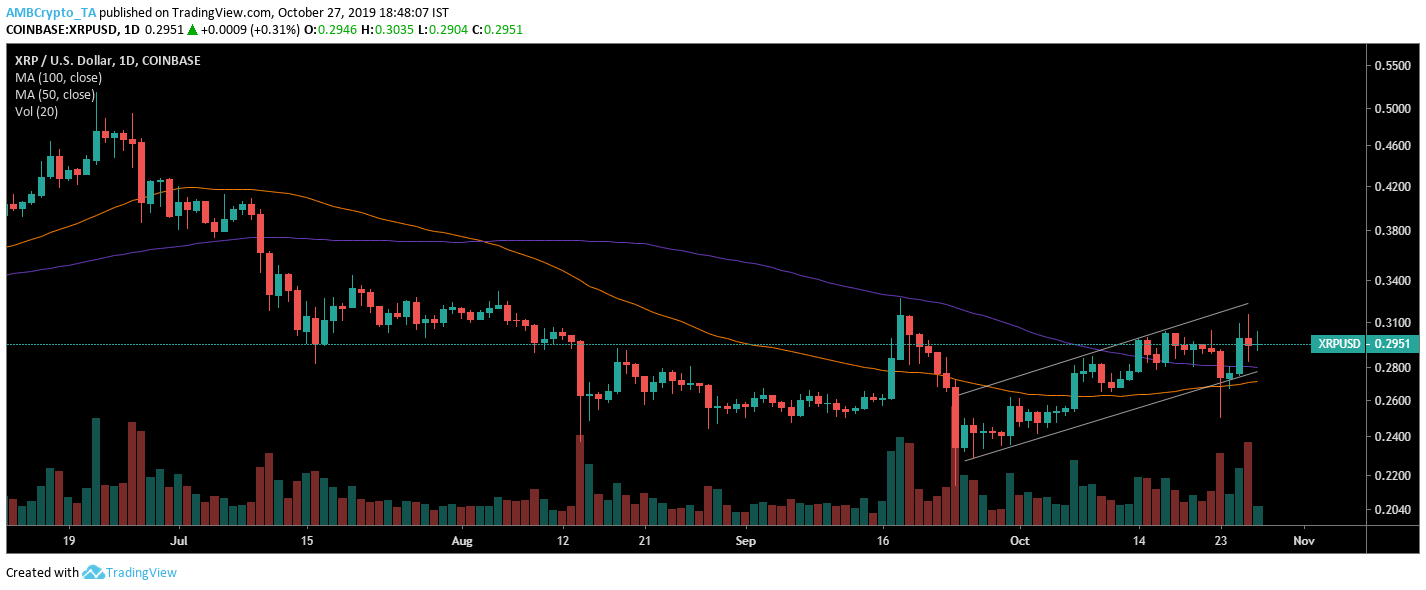
Despite the XRP’s attempts to breach $0.3000 over the last couple of days, the one-day chart of the altcoin revealed the formation of an ascending channel pattern which is a bearish pattern. The ascending channel pattern in the chart was detected by the formation of higher highs at $0.2870, $0.2997 and $0.3048 accompanied by higher lows at $0.2291, $0.2349 and $0.2740. The increasing volume affirmed the formation of the ascending channel pattern. As per the nature of the pattern the breakout is most likely toward the downward direction.
Additionally, the moving average indicator also confirmed the presence of the bears in the XRP market as the 100 moving average was seen above the 50 moving average. The 50 moving average seems to be standing as support from the beginning of October while the 100 moving average which acted as resistance for a long time was breached by XRP during the second week of October.

Source – XRP/USD on Trading View
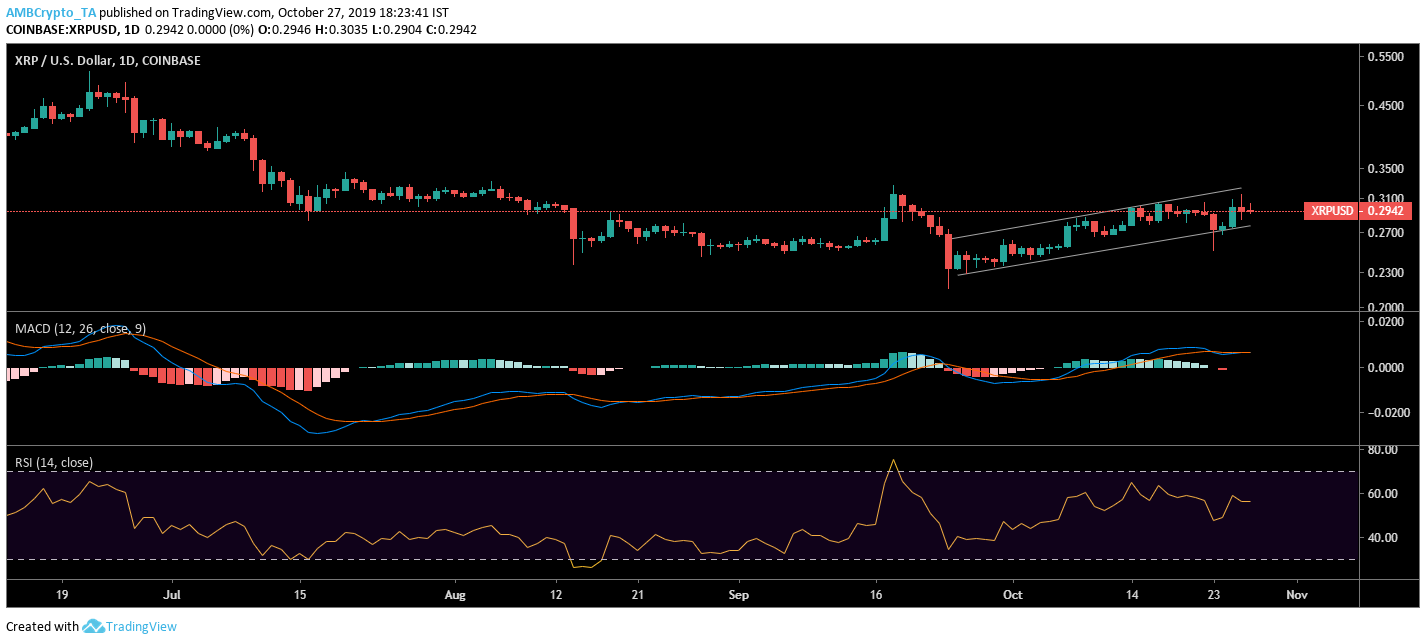
MACD also endorsed the presence of the bears. The MACD line seen above the signal line for quite some time now, however, the signal line overtook the MACD line eliminating the presence of the bulls in the XRP market.
However, the RSI line in the Relative Strength Index indicator was seen above the 50 median further hinting at the presence of the bulls.
Conclusion
Bears have taken over the XRP market as ascending channel pattern, as well as key indicators, reveal strong bearish sentiment.


