XRP

XRP’s price may note an upsurge in the short-term as coin prepares for breach of ascending triangle
Posted:

XRP’s performance has been bearish for most of 2019, and the bears are not ready to quit yet. The coin registered a devaluation of 6.40% on September 6 and the lowest bid was marked at $0.2461, close to its support at $0.2419. The coin has put in a solid effort to recover from the fall, but recovery has been maintained within the $0.25 range.
The short-term charts of the coin have been suggesting some probable growth, but this could just be a revival effort.
1-hour
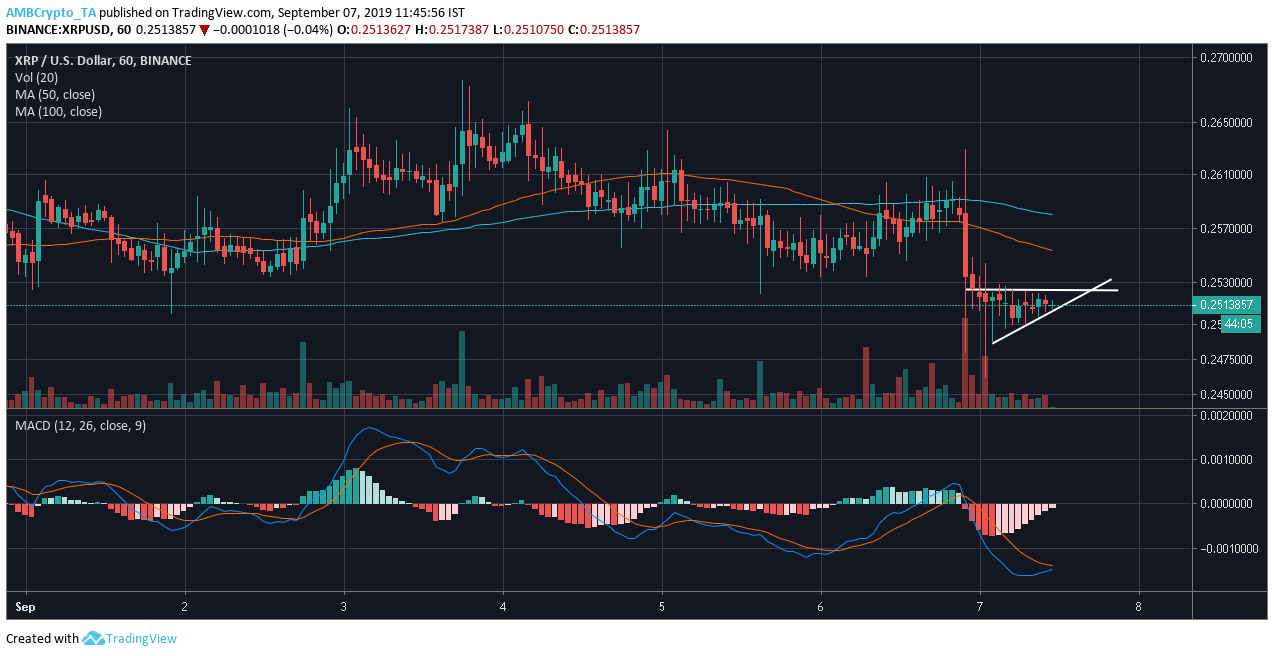
Source: Trading view
XRP’s 1-hour chart indicated the formation of an ascending triangle pattern. The slope linked swing lows are at $0.2488, $0.2501, and $0.2504, while the horizontal line connected a series of swing highs at $0.2528. Considered a bullish pattern, the ascending triangle could lead to a rise in the price of the contentious coin.
The 50 moving average rested under the 100 moving average after a crossover on September 6, a sign of the declining market. On September 1, the XRP market was taken over by a bullish trend as the 50 moving average sprinted above the 100, but the growth of the coin within this bullish wave has been a minimal 0.55%. After the 100 moving average picked up its pace, the coin had fallen by 2.56%, at press time.
The MACD indicator reasserted the bearish trend prevalent in the market. However, the MACD line has been teasing overtaking the signal line, inversing the trend to a bullish one.
4-hour
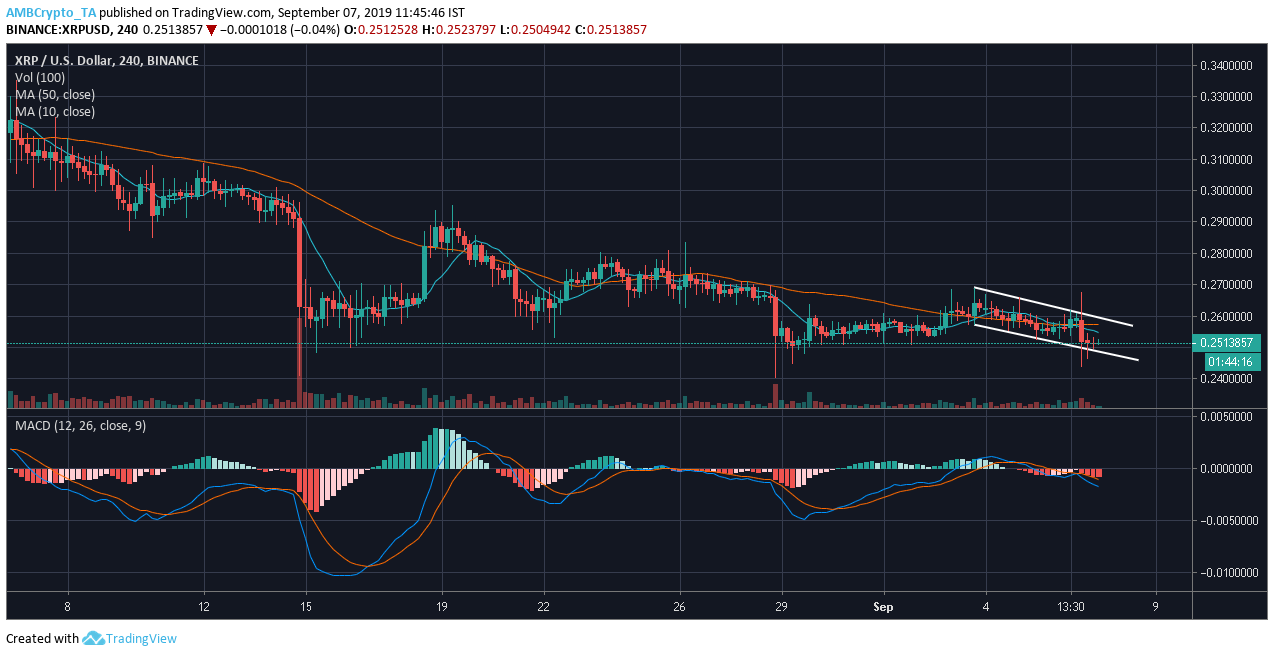
Source: Trading view
XRP’s 4-hour chart also indicates some relief for the coin, with the formation of a descending channel. The channel is defined by connecting the lowers highs at $0.2686, $0.2655, and $0.2610 and the lower lows at $0.2570, $0.2552, $0.2527 and $0.2488. The descending channel may result in a slight rise in the coin’s price.
The 50 moving average was over the 100 moving average on September 3, but underwent a bearish crossover on September 6. XRP’s price took a hit by 3.99% within these three days, but with the 50 moving average hovering above the 100, another rise in XRP price is expected.
The MACD indicator highlighted strong bearish momentum in the market. Thus, even if the coin breaks out of the descending channel, the rise could be meagre one.
Conclusion
The price of XRP might be pushed up with the breach of the ascending triangle and descending channel pattern.