It has been a pretty stagnant week for the third-largest cryptocurrency, XRP as it appeared to be battling below $0.195-mark. Just a couple of days before the coin almost reached $0.200-mark, the coin retraced its steps. At press time, XRP was trading at $0.194.
XRP Hourly Chart:
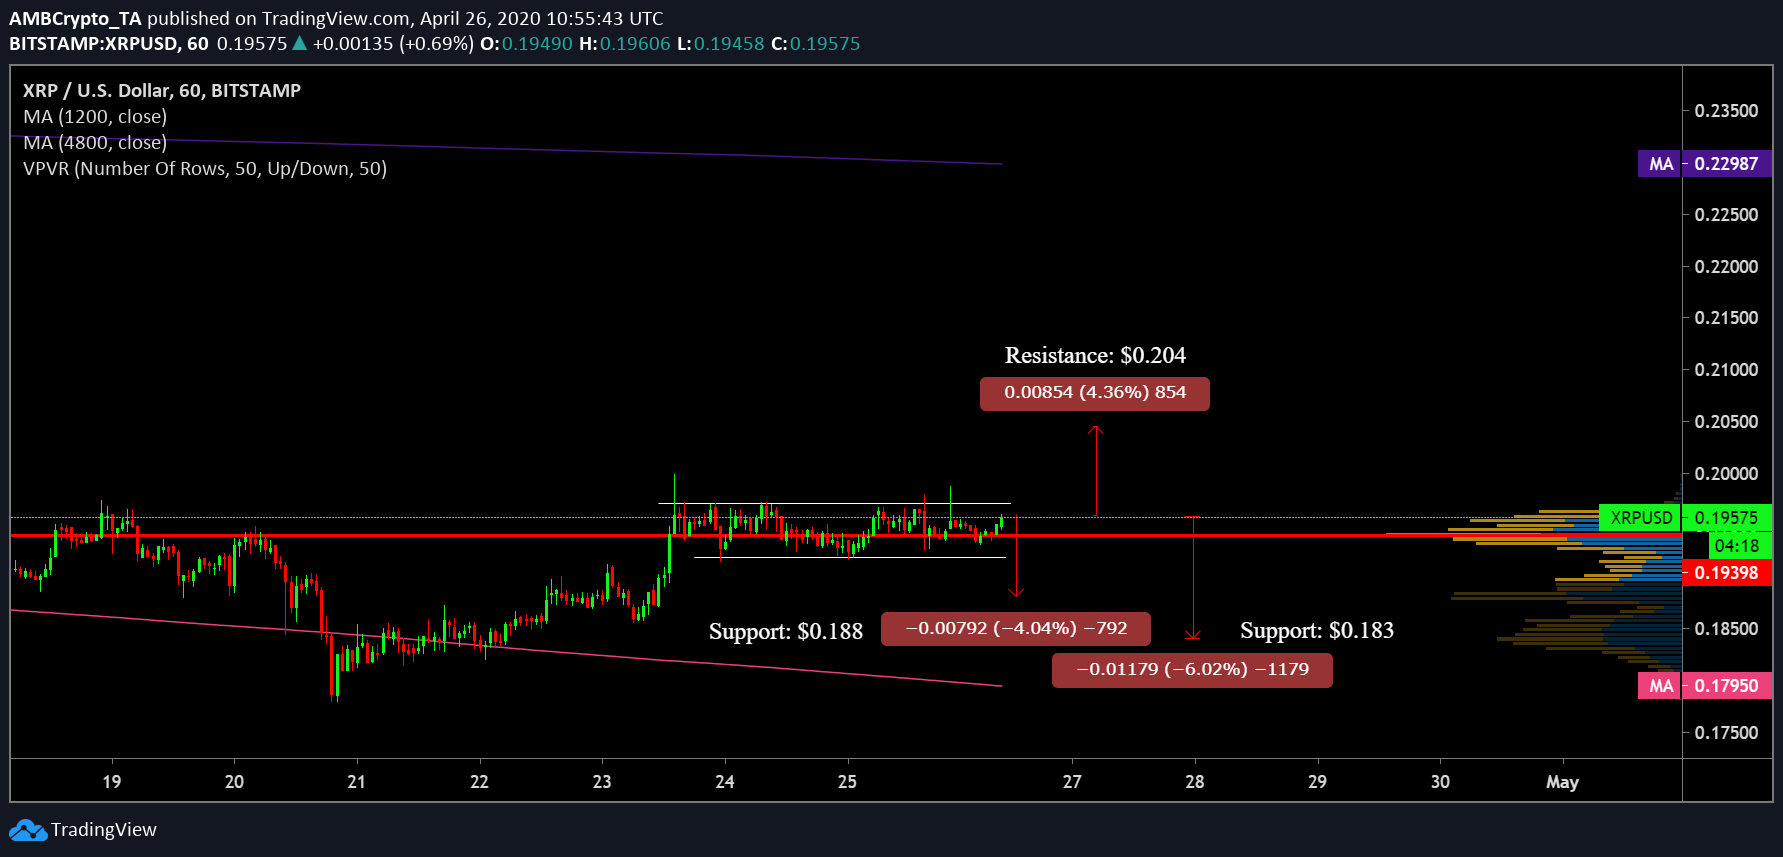
Source: XRP/USD on TradingView
XRP has been on a steady incline. The price shot up from $0.189 and briefly touched $0.195. Following this price action, there was a formation of sideways and rangebound pattern. This pattern restricted XRP candles from moving beyond $0.197.
Even the daily moving averages have been limiting the price movement of the coin. The gauge of the 50 daily moving average [Pink] and that of the 200 daily moving average has been expanding after the death cross. With no signs of a possible convergence around the corner, placements of the daily moving averages seem to have sided with the bears.
200 daily moving average has been acting as a resistance level since 26th February while 50 daily moving average slid below to form support in the first week of April.
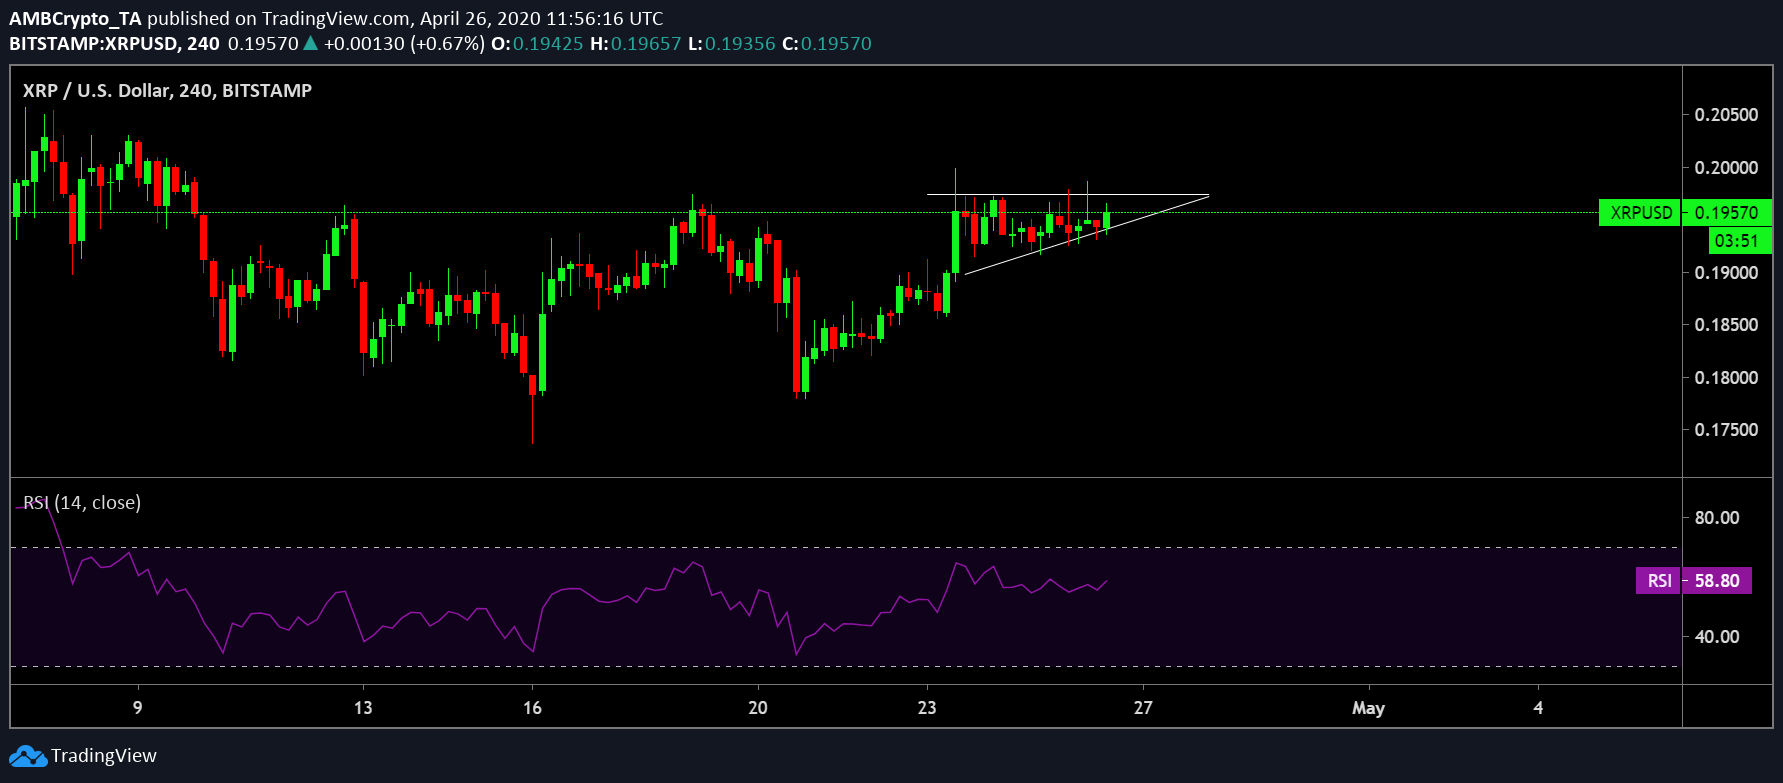
Source: XRP/USD on TradingView
Scenario 1: Consolidation
As the price seems to have muted along the channel, XRP could potentially remain in a consolidated position for some time now. VPVR also displayed a high trading activity in the current range of $0.193-$0.195.
Scenario 2: Slide
The bearish presence on the hourly chart cannot be overlooked. In addition, VPVR also depicted a high trading activity in the $0.188 support level. This was indicative of the fact that if the XRP price candles happen to sustain a bearish breakout in the near-term, it is likely to fall to the said point. Furthermore, if the downtrend gains momentum, the coin could decline to $0.183 in the short-term. This was suggested by VPVR displaying an increased trading activity close to the second support point.
Additionally, the formation of a symmetrical triangle pattern and RSI, forming lower highs, exhibited a bearish divergence. This further indicated a downtrend in the near-term for XRP.
Scenario 3: An uptrend
In case of a trend reversal and if the coin manages to breach the aforementioned range, its price could climb all the way up to $0.204.
Conclusion:
The sideways rangebound pattern has trapped the coin below $0.195. The coin could either keep consolidating for the next few days within the range of $0.193-$0.195, as depicted by VPVR. However, a strong bearish breakout, supported by the daily moving averages, VPVR indicator, as well as the bearish divergence of RSI on the 4-hour chart could be in the offing. If this materializes the coin could be retested at $0.188 and $0.183, respectively. In a highly unlikely scenario of a bullish break, XRP could be resisted at $0.204.