
Disclaimer: The following article attempts to analyze the evolving pattern in the XRP short-term market and its impact on the price.
The price of the largest cryptocurrency Bitcoin [BTC] escalated on 28 July causing the major alts to witness a brief period of volatility in the market. The fourth-largest cryptocurrency, XRP which had been under bearish pressure spiked to price levels not seen in a while.
This was possible due to the strong correlation shared between XRP and BTC. Although not a peak, the correlation between the two major assets stood at 0.8573, even after dipping from a peak at 0.8767 in May.
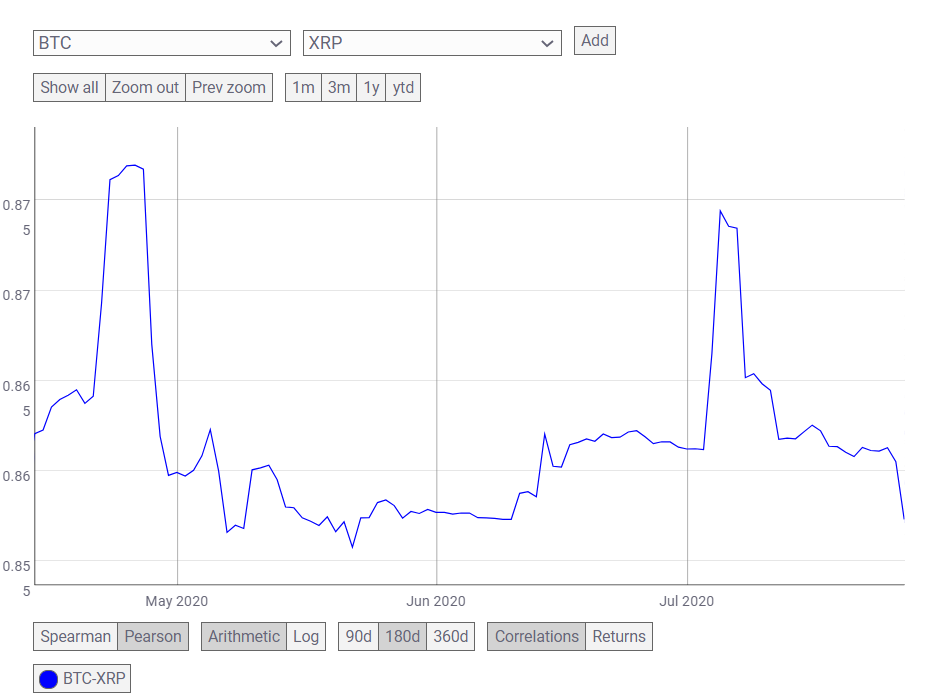
Source: CoinMetrics
At press time, XRP was being traded at $0.2206, while the market cap of the coin remained $9.86 billion. It was reporting a 24-hour trading volume of $1.81 billion while surging by 0.70% within the past hour.
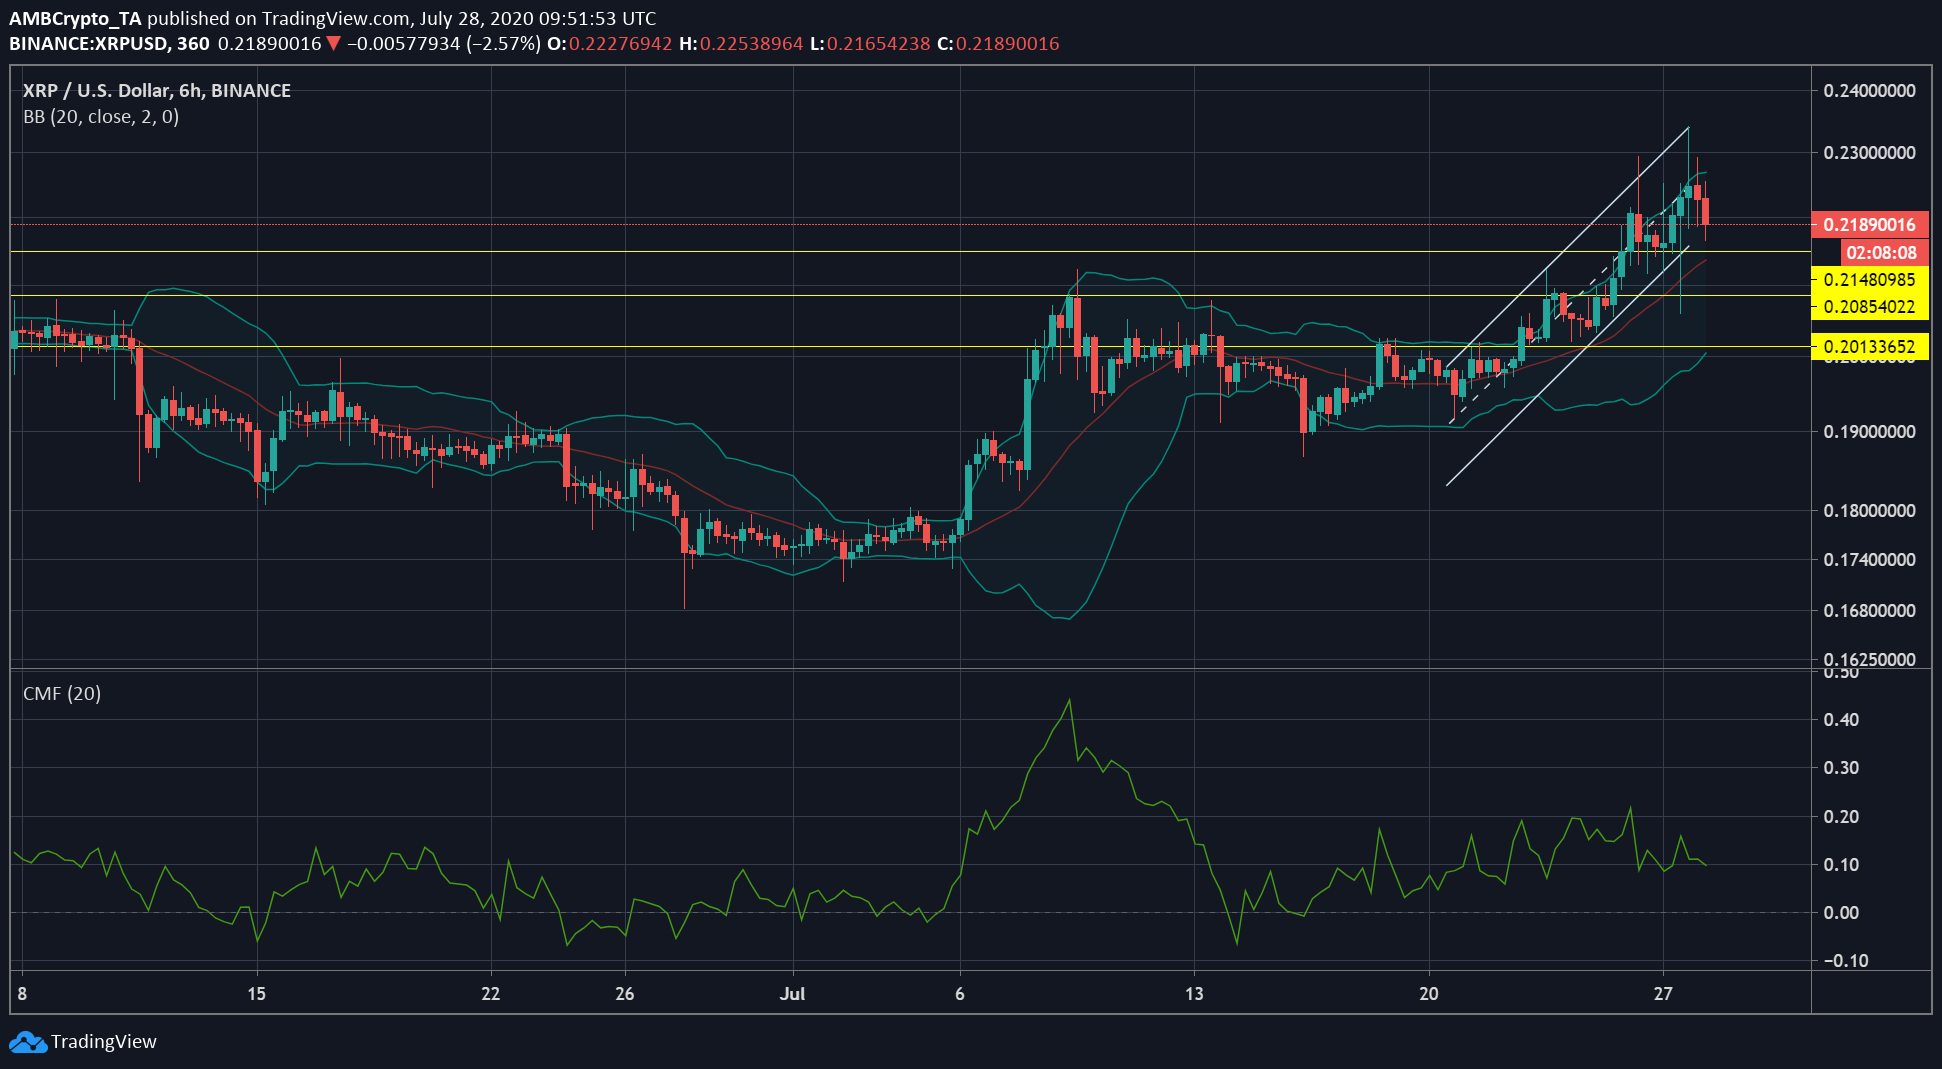
Source: XRP/USD on TradingView
As per the short-term chart of XRP, the coin was forming a part of an ascending channel. The value of XRP has been rising since 20 July. The higher highs and higher lows formed in the past few days were connected by two separate lines forming a channel, while the volatility in the market also increased.
This increase in volatility was confirmed by the Bollinger Bands indicator, which diverged as the price of XRP climbed higher. Whereas the signal line, that indicated the pressure in the market was under the price bars, suggesting the market was currently in an uptrend. However, as the price moved along the rising channel, the break down of the coin was now becoming imminent.
XRP was moving deeper into the buying zone as pointed out by the position of the Chaikin Money Flow [CMF]. As the signal line moved away from 0, it indicated a rise in buying pressure, confirming an uptrend. Any changes in the price trend will cause the CMF to trend lower and may confirm the break down when it takes place.
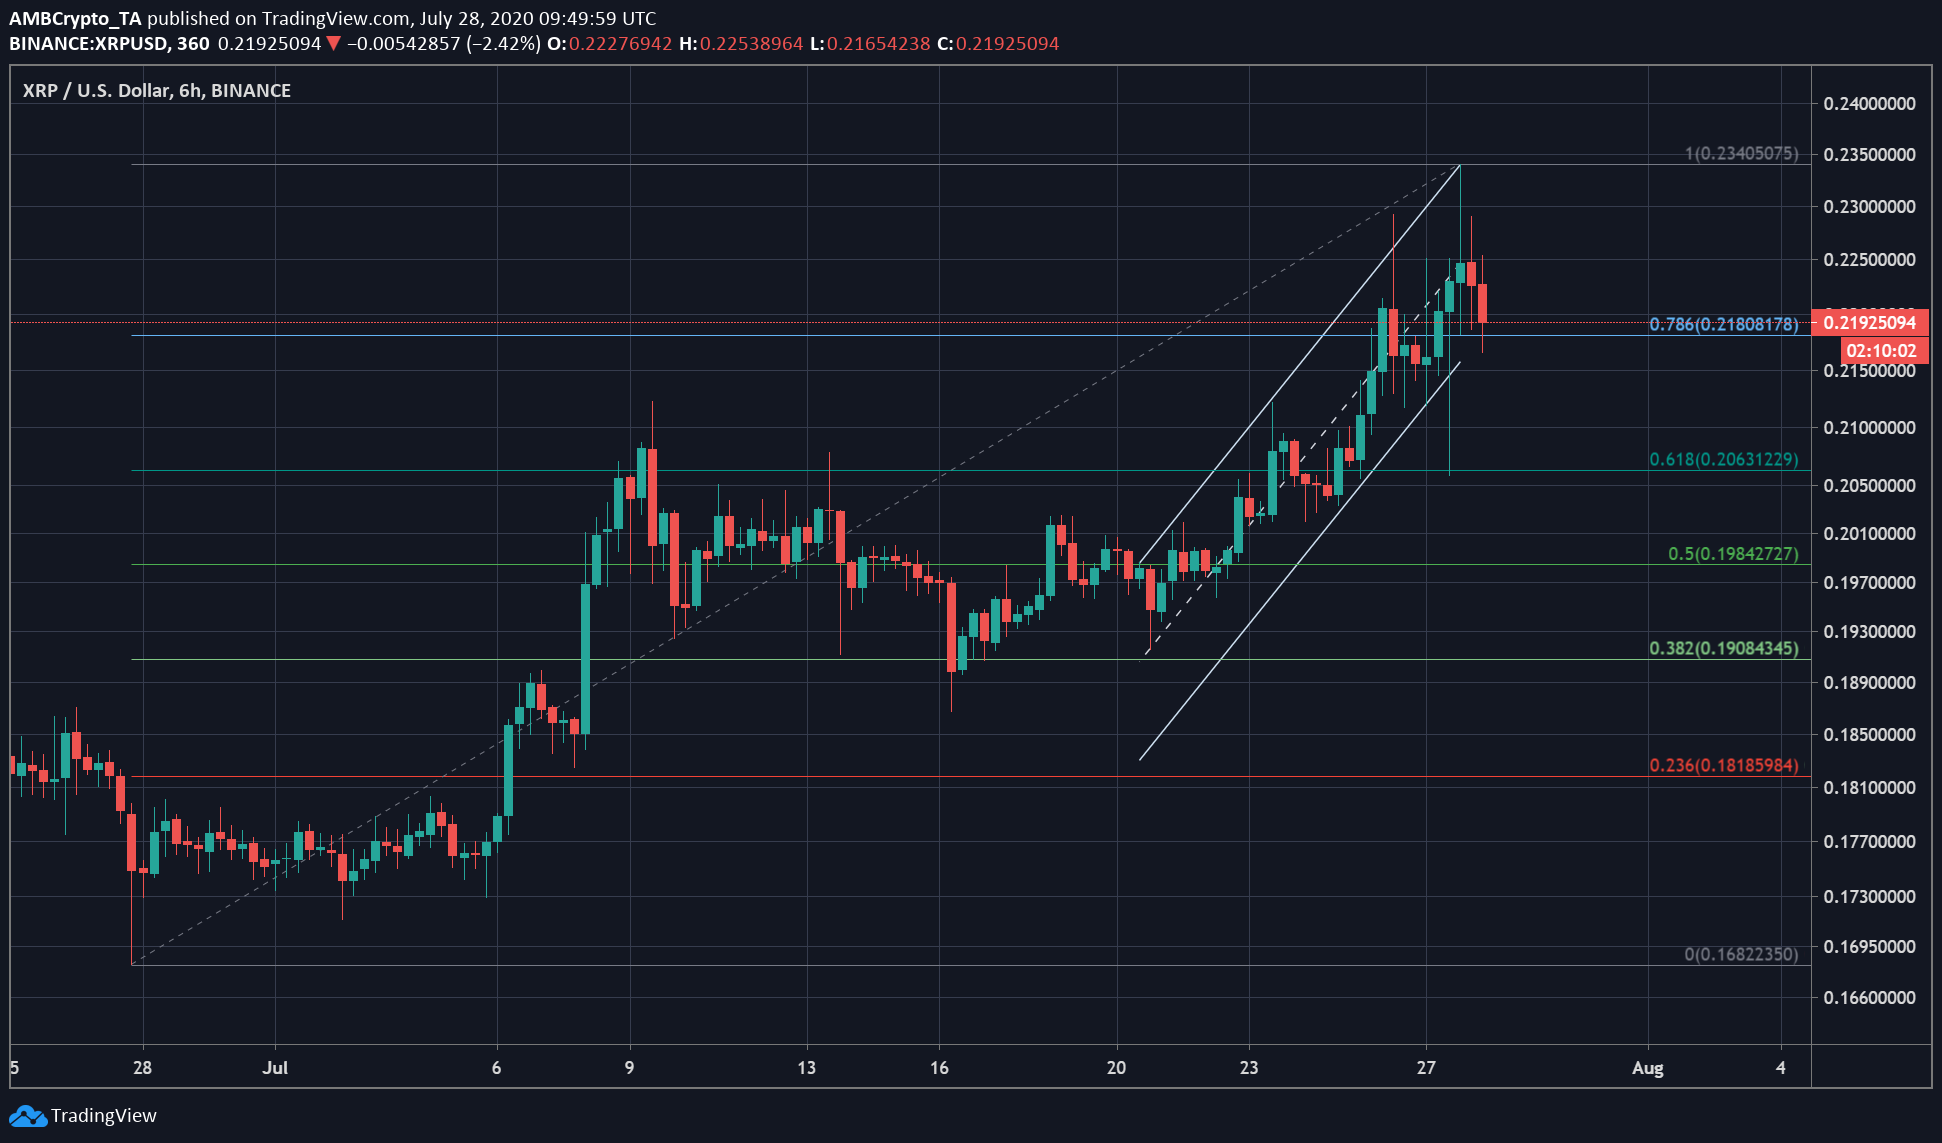
Source: XRP/USD on TradingView
According to the Fib retracement, strong support has been marked at various price levels. As XRP traded at $0.2192, the closest support was at $0.2192, which will act at its first target trading lower. If the coin keeps up with the downward momentum, it may slide to $0.2063 value which has been strong support for the asset’s value in the 6-hour time frame. It is important for XRP to hold on to this level as another slip will push it down to $0.1984.