Disclaimer: The conclusions of the following analysis should materialize in the next 3 days.
On 17 June, XRP noted a rapid decline of 3.80 percent in just a couple of hours, with the crypto-asset continuing to depreciate on the charts since. In fact, the major support at $0.190 had turned into a resistance point, with the asset maintaining a position above the new support at $0.186, at press time.
XRP was valued at $0.187, at the time of writing, with the crypto-asset having a market cap of $8.26 billion.
XRP 1-hour chart
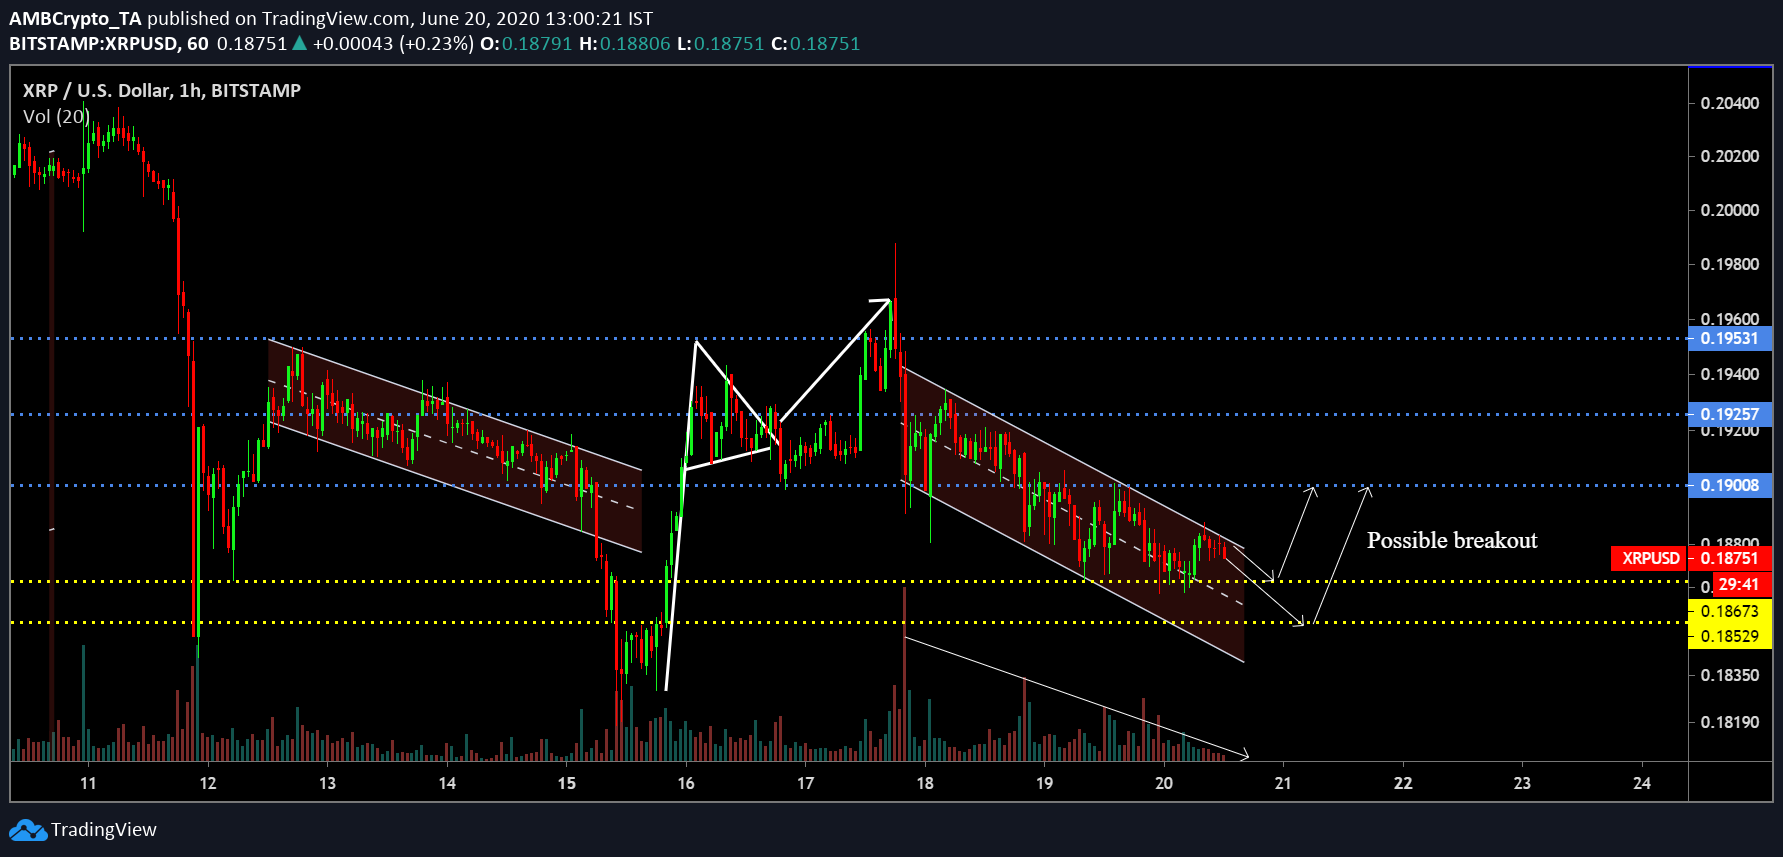
Source: XRP/USD on TradingView
Inconsistency has been fairly evident on XRP’s short-term chart over the past 8-10 days. In fact, steady trading activity has been absent at any particular range, with the token noting a series of decline and surges over the period. However, there is a peculiar similarity between the trend that was registered from 12 June to 15 June and the present trend that has been extending since 17 June.
On both the occasions, XRP oscillated under a descending channel, but the former pattern underwent a pullback before embarking on a short-term rally. The price was able to breach the $0.195 mark briefly, before making another movement towards $0.190.
Now, if history were to repeat itself, XRP may decline down to $0.181, but a quick pullback to $0.190 will possibly surface as well. The immediate support remained at $0.185 and $0.185, levels that could also be the base for a bounceback on the charts.
Further, the falling trading volumes were coherent with the declining price. Hence, a trend reversal should contribute to a spike in both the valuation and activity.
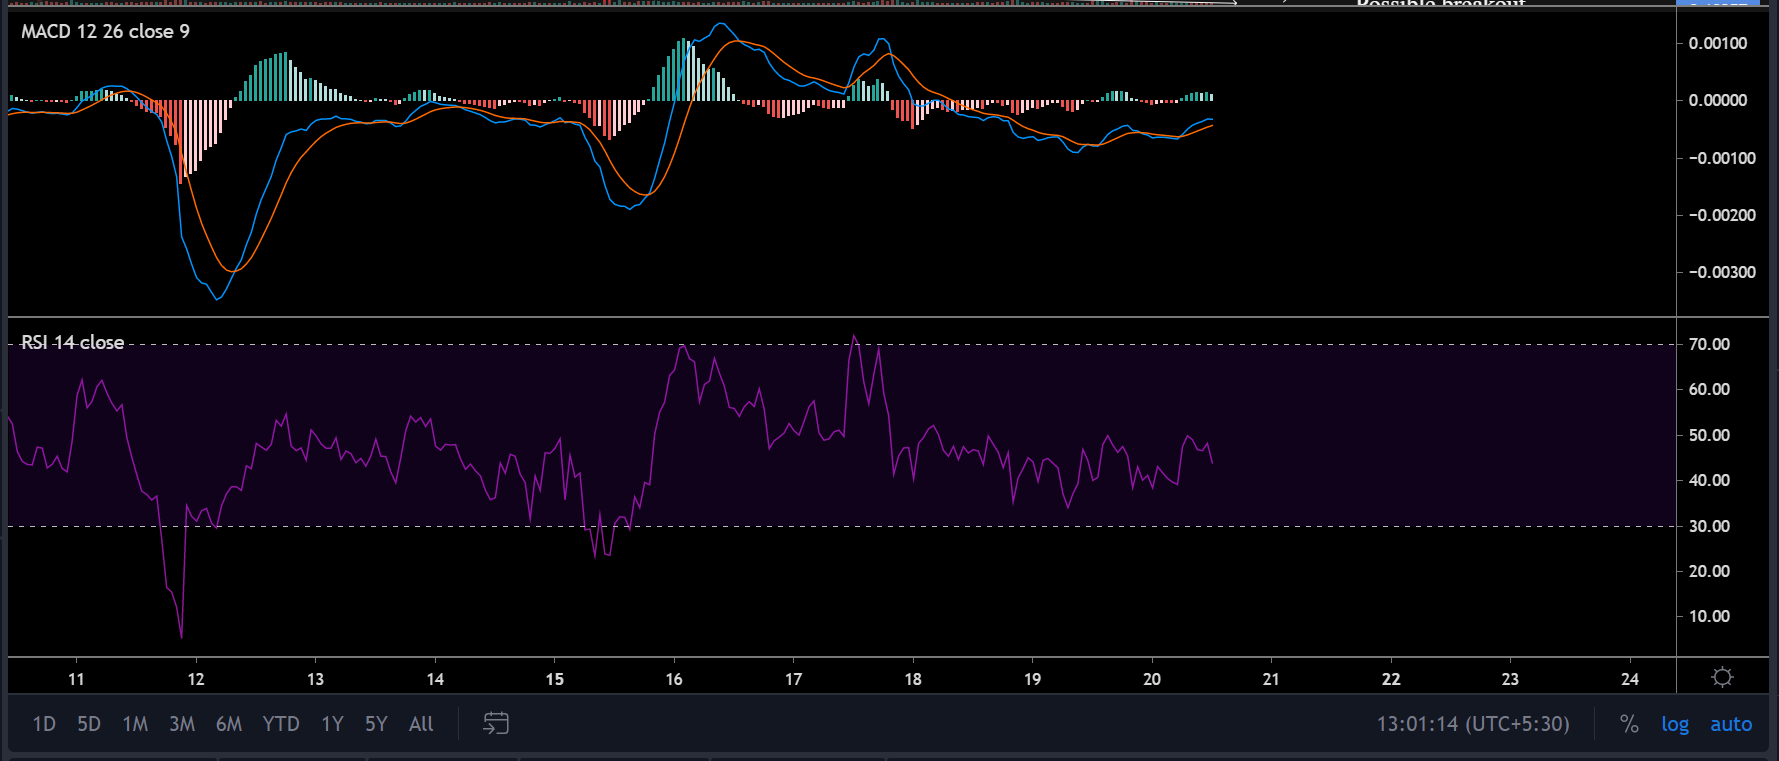
Source: XRP/USD on TradingView
Interestingly, market indicators were split right in the middle. The MACD line continued to uphold a bullish trend for the token, indicating that a breakout might take place at any time.
However, the Relative Strength Index or RSI seemed more skeptical with buying pressure losing its momentum to selling pressure on the charts.
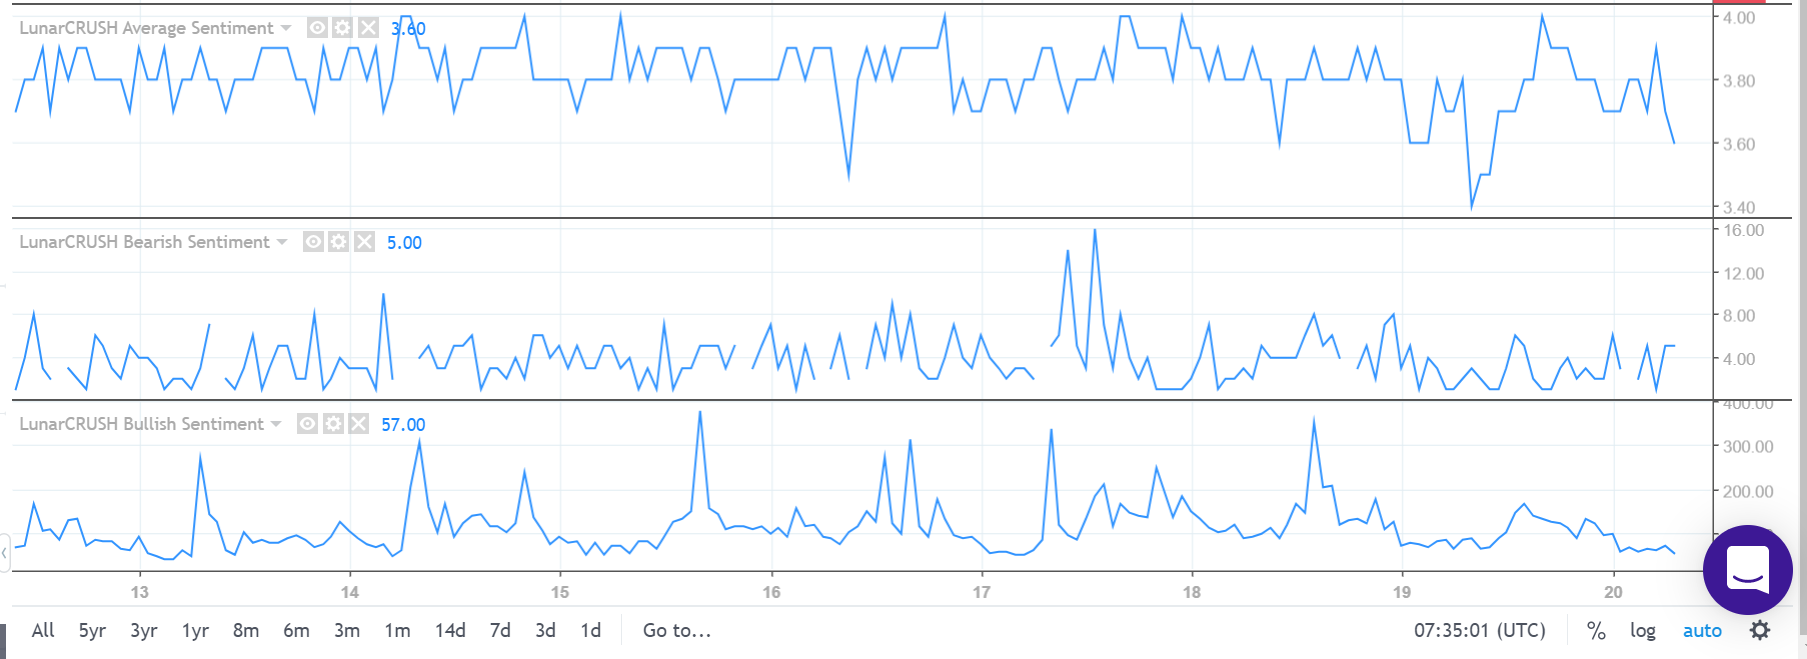
Source: Lunar Crush
Further, sentiment analysis remained on the bearish side as well. According to a dataset by LunarCrush, XRP’s Average sentiment was veering towards a decline, with bearish sentiment holding a high position and bullish sentiment noting a slide. Hence, the analysis further suggests that a pullback will be registered before another hike.
Conclusion
Considering past movement, XRP may decline below its support at $0.185, but a subsequent bullish movement should see the price re-test resistance at $0.190 by 23 June.