
Disclaimer: This analysis will attempt to foresee changes in XRP’s price charts for the next 12 hours
Due to the lack of any meaningful price action, XRP has been struggling to retain its position as the world’s fourth-largest cryptocurrency by market cap on CoinMarketCap’s list. At the time of writing, XRP was being traded at $0.190 after falling by 2.59 percent over the last 24-hours. In fact, the recent market dip had pulled the coin away from its crucial resistance on the charts. However, short-term upward price action could be right around the corner.
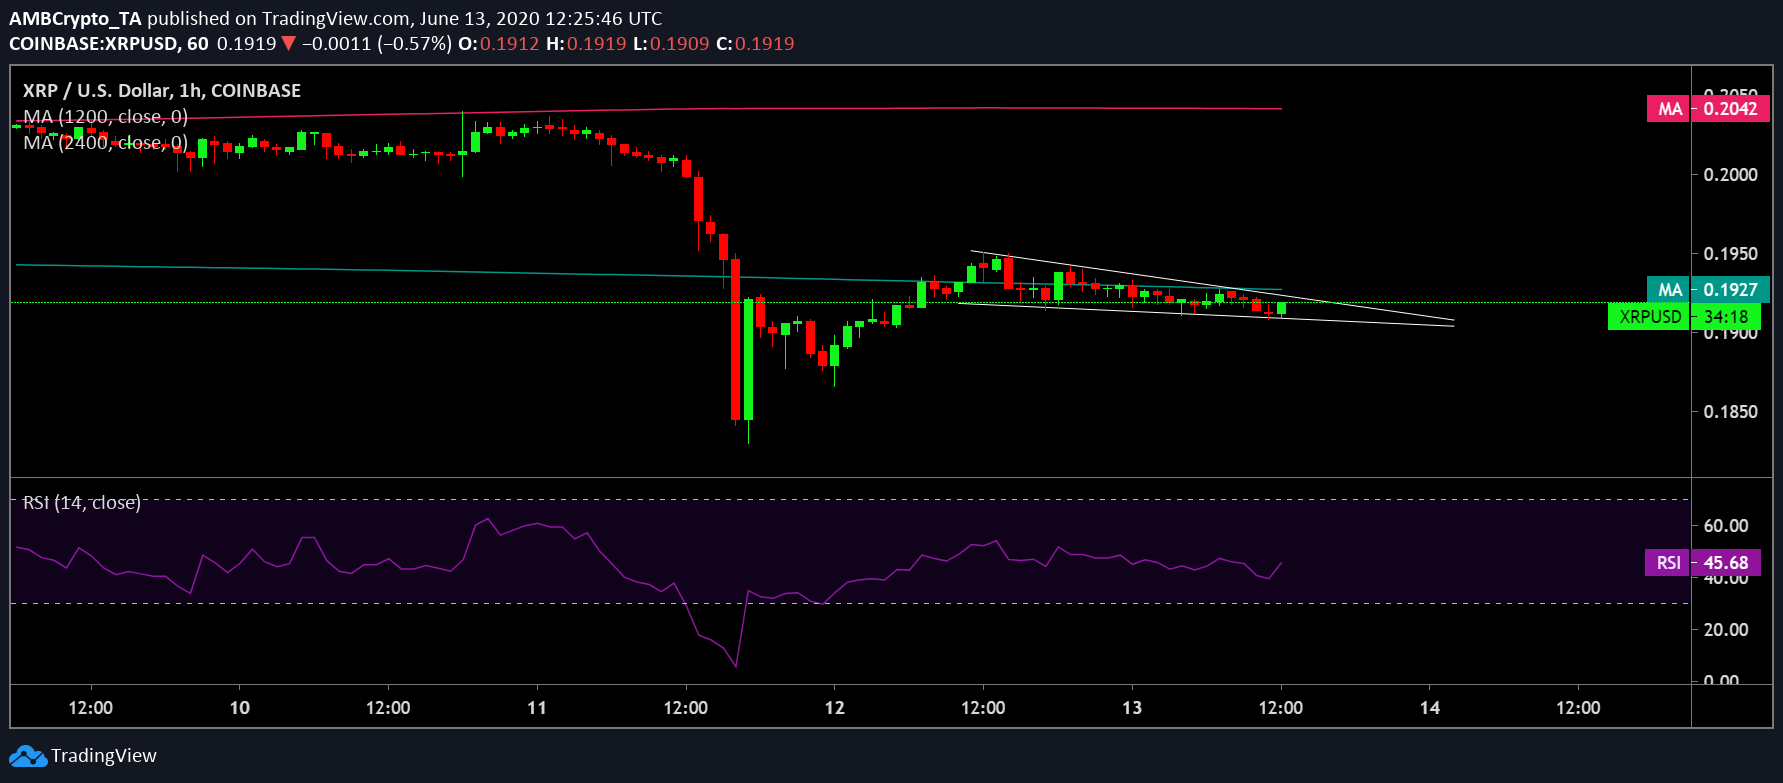
XRP 1-Hour Chart

Source: XRP/USD on TradingView
XRP’s price candles were observed to be oscillating between two downsloping trendlines, forming a falling wedge pattern on the short-term price chart. A breakout on the upside was predicted following the completion of the wedge. XRP underwent a golden cross in the last week of May when the 200 DMA [Purple] slid below the 50 DMA [Pink]. Following this, the gauge has been expanding, with a bearish impulse not to be found. At the time of writing, the placement of the two daily moving averages pointed towards a bullish phase for the coin.
Source: XRP/USD on TradingView
The RSI also appeared to make headway upwards, closer to the 50-median neutral zone on XRP’s hourly chart. This indicated decreasing sell pressure sentiment among investors of the XRP market, which was, again, a positive sign.
The falling wedge pattern, the placement of the two daily moving averages, as well as upward moving RSI, all pointed towards a potential bullish breakout on the 13th of June. If this materializes, the coin could soar higher to price levels of $0.194 and $0.201, respectively, as implied by the VPVR indicator with high trading activity. If the bullish trend persists, the coin could further climb up another resistance point close to the 50 DMA at $0.204, a level that has been resisting the coin’s upward price action.
The coin also found supports at $0.189, $0.187, and $0.184.
Correlation

Source: Coin Metrics
Bitcoin’s recent dip has managed to drive the prices of its peer altcoins down below key levels. XRP is no stranger to Bitcoin’s swing. At the time of writing, the BTC-XRP correlation coefficient stood at 0.815, according to CoinMetrics. If Bitcoin manages a surge in the short-term, this could act as a catalyst for XRP’s price action, one that appeared to undergo a break to the positive side.
Conclusion
XRP’s price appeared to have stagnated. However, the attached charts pointed towards a bullish breakout in the short-term, the target points for which stood at $0.194, $0.201, and $0.204,