XRP long-term Price Analysis: 24 June

Disclaimer: The conclusions of the following analysis should materialize by the 2nd week of July.
In the month of June, XRP’s valuation has fallen by approximately 14 percent on the charts, with the price dropping down to $0.185, at press time, from $0.211 on 1 June. Facing consecutive bouts of bearish pullback, the crypto-asset failed to maintain its position as the world’s 4th largest cryptocurrency, with the token having been outperformed by Tether in the first week of June.
This trend looks increasingly less likely to change in the near-term, but the month of July may bring forward a period of change for one of the market’s more popular cryptocurrencies.
XRP 12-hour chart

Source: XRP/USD on TradingView
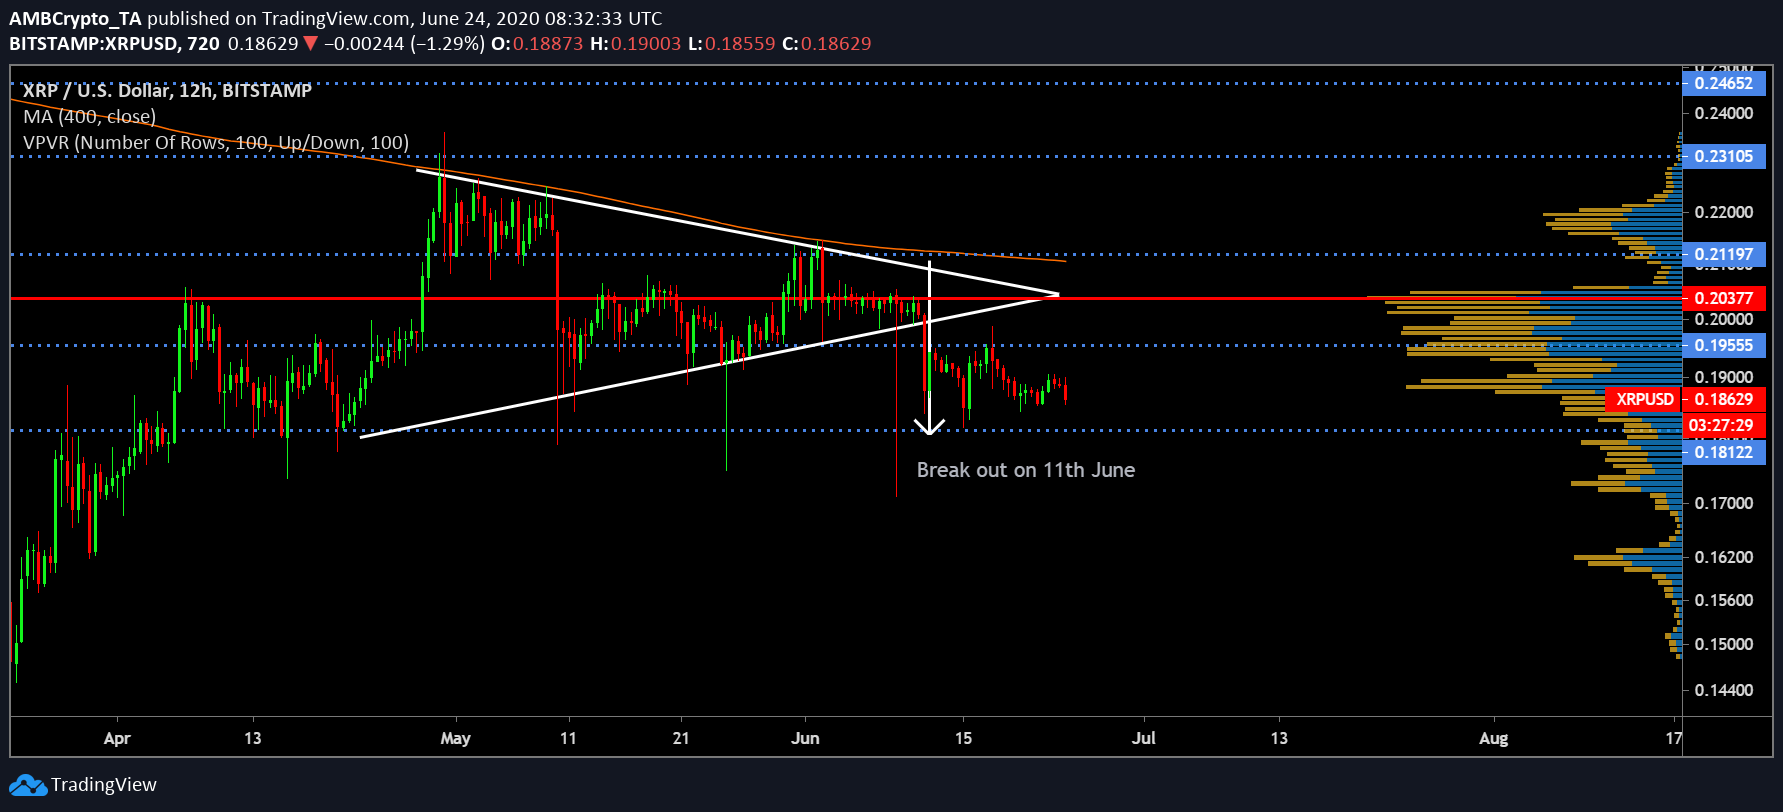
The attached chart illustrated that XRP, at the time of writing, was consolidating under the resistance level of $0.195 due to a negative breakout following the formation of a symmetrical triangle. With bears controlling the early couple of weeks in the month of June, XRP underwent a pullback on the 11th, with the price dipping significantly below its $0.20 resistance on the charts.

XRP/USD on Trading View
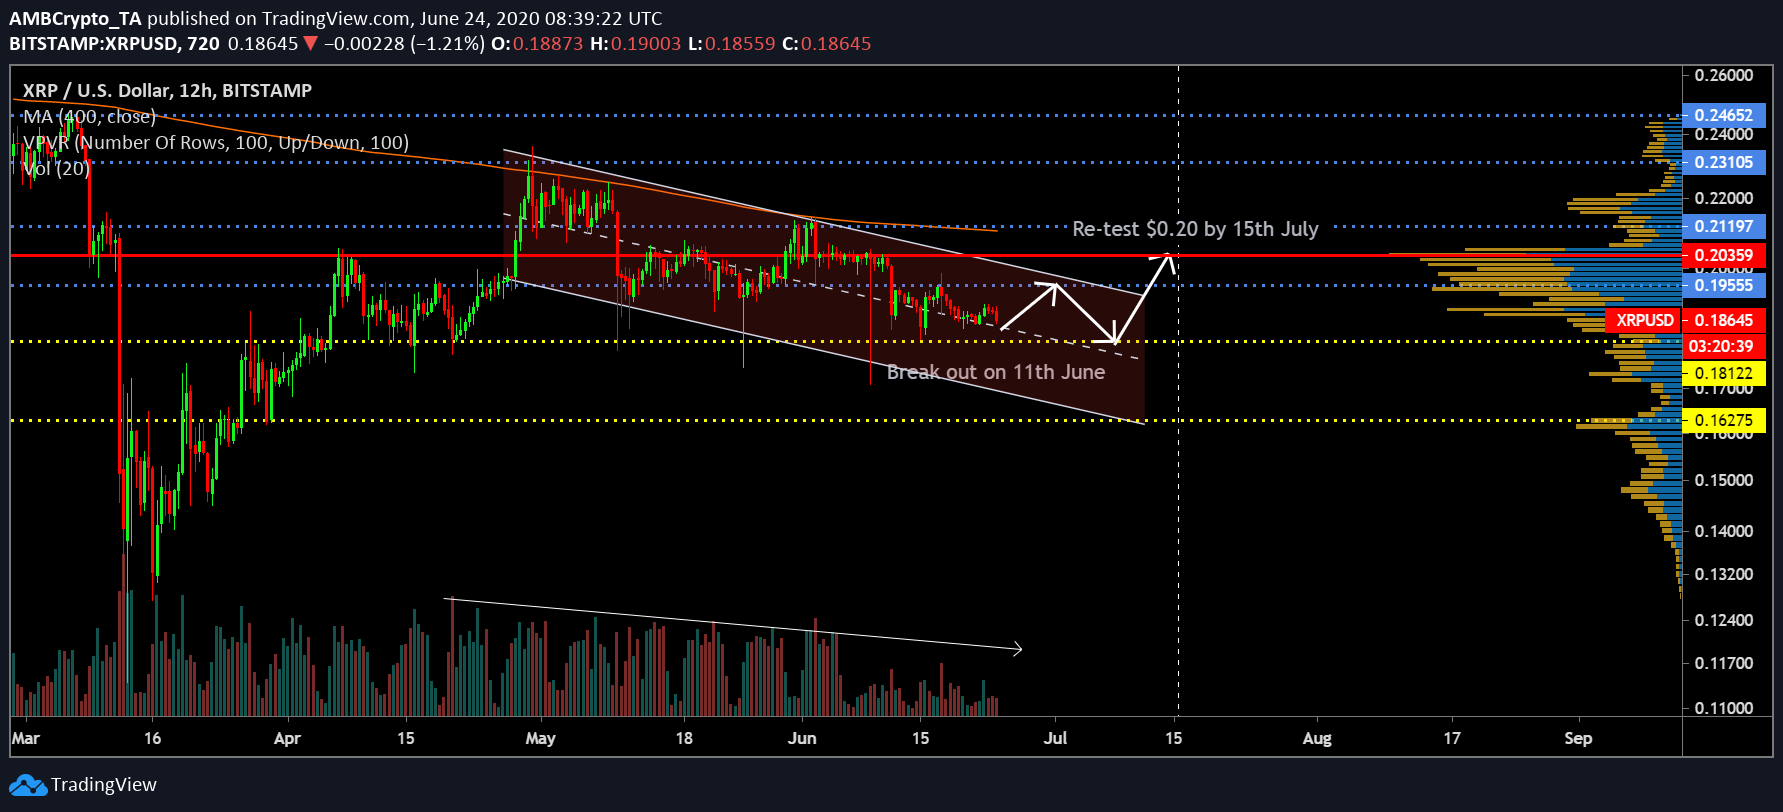
Now, over the past 13 days, the crypto-asset has been able to sustain a position between $0.195 and $0.181, with a brief re-test of $0.195 on 16 June. At the time of writing, XRP’s price remained between the trendlines of a descending channel, with the price moving above the average position.
Strong lower-highs pointed to the tenacity in breaching the $0.20-mark, but the lack of bullish momentum was restricting XRP’s forward movement. Facing the possibility of a bullish breakout from the descending channel pattern, XRP was most likely to re-test $0.195 once more over the week, before undergoing another pullback.
Re-test at $0.20 may happen sometime in mid-July, if external stimuli do not hassle the token’s momentum. Strong VPVR at $0.20 highlighted the Line-of-Control at the aforementioned resistance, hence, a breach above $0.20 may or may not take place in the month of July. However, a re-test might be fairly possible.
The minor decline in trading volume, alongside XRP’s price, was a positive sign for the chances of a trend reversal. However, the 200-Moving Average continued to fall and develop its position as overhead resistance.

Source: Trading View
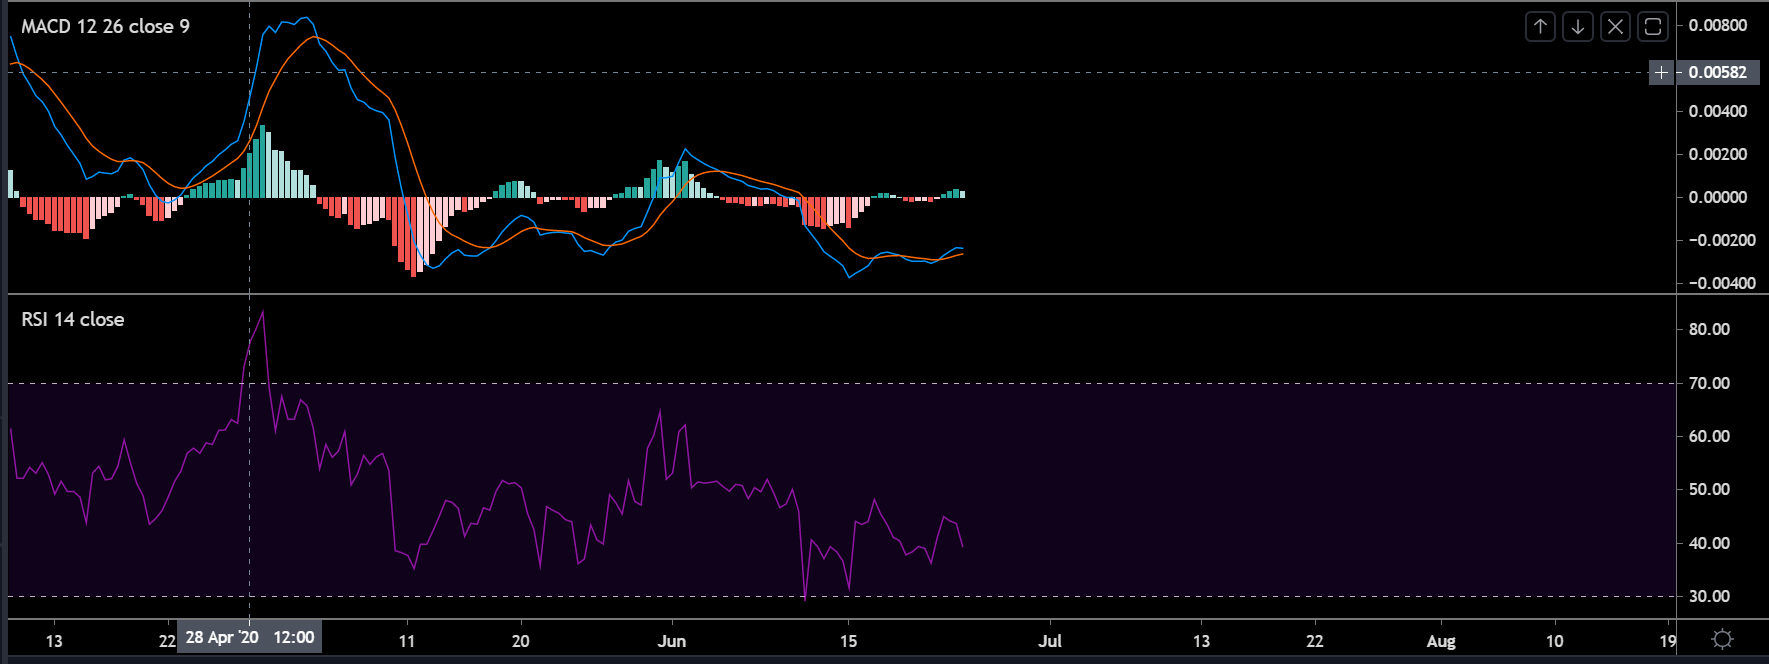
XRP’s market indicators remained split for the crypto-asset. While the MACD idealized a bullish narrative for XRP, with the blue line hovering over the red line, the Relative Strength Index or RSI pointed to increasing selling pressure on the charts.
Conclusion
XRP may re-test $0.195 by the end of this week, before possibly testing resistance at $0.20 by mid-July.


