
It appears as if XRP’s troubled times are not over. After the fateful death cross a week ago, the coin retraced its steps to the previously breached level of $0.172. This downtrend is supported by the formation of a rising wedge pattern.
XRP 4-Hour Chart:
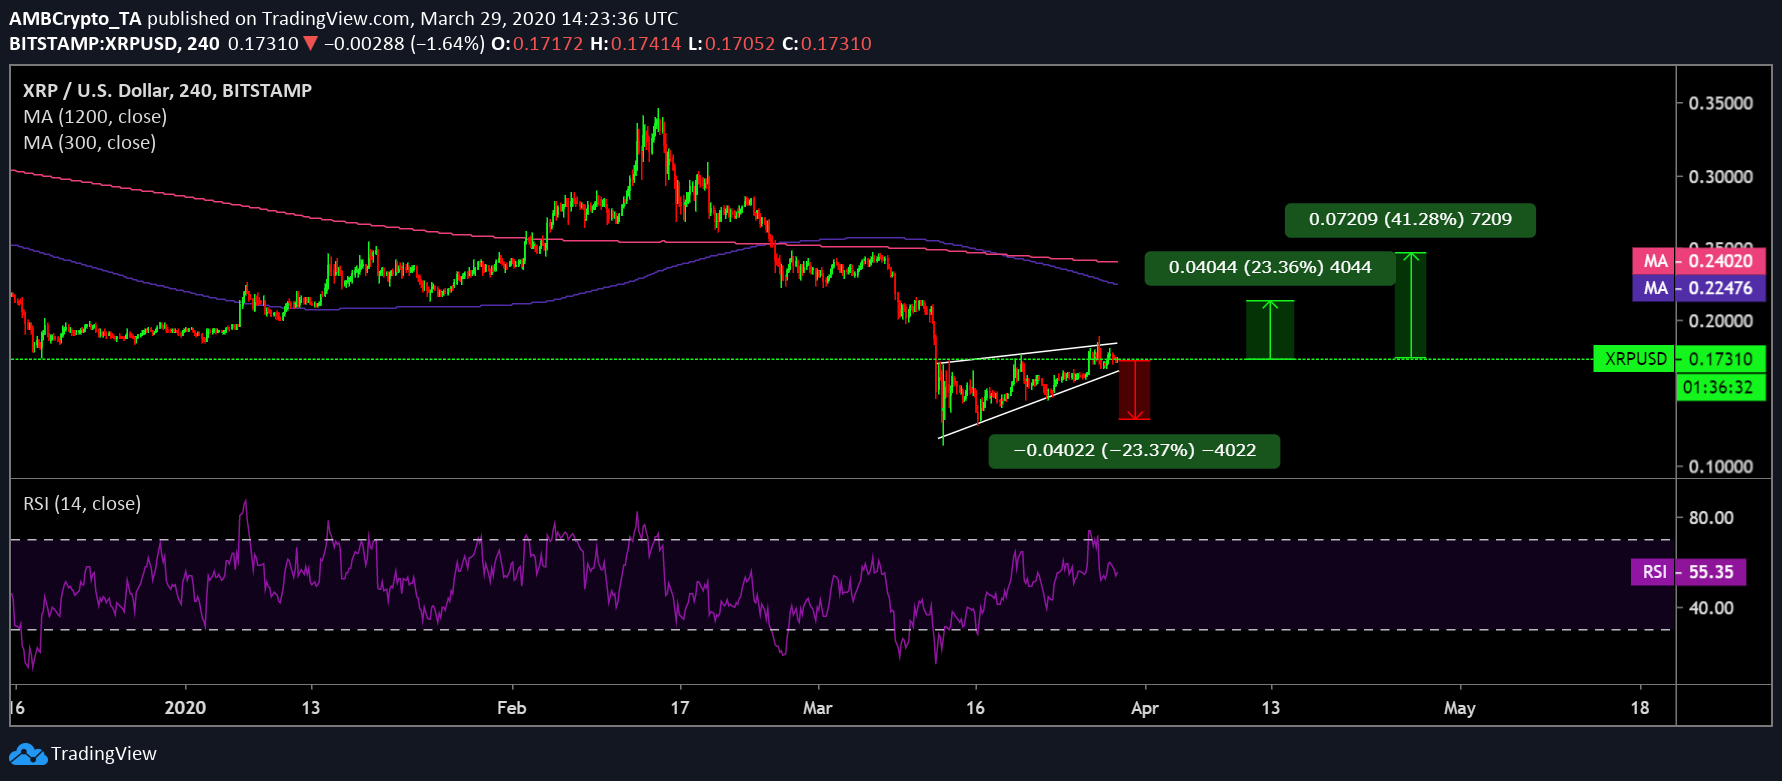
Source: XRP/USD on TradingView
The rising wedge has taken shape over a period of two weeks starting from the day of the great fall from 12th March to the 29th March as XRP’s price oscillated between two rising trendlines. The formation of this pattern was indicative of a potential price breakout to the negative side in the short term.
Following the death cross on 18th March on the XRP chart, the bearish trend has been persistent even now. The gauge of the two moving averages has since expanded with the smaller moving average moving below the higher one. This also depicted a bearish phase for the coin.
Another factor that validated the bearishness in the XRP market was moving averages that hovered above the price candles. Both 200 daily moving averages [Pink], as well as the 50 daily moving average [Blue], were above the candles.
Relative Strength Index [RSI]:
RSI indicator shot up above the oversold zone on 27th March which was speculated to have reignited the interest among the investors in the XRP market. However, the coin has failed to retain the momentum as the indicator fell near the median and has been struggling close to it ever since. This depicted uncertainty among the XRP investors in the near-term.
With the bearishness weighing down on the coin, XRP could potentially undergo a downside breakout in the short-term. If this materializes, the coin could find itself testing support at $0.131, a level that was last seen on 16th March this year. However, in an unlikely scenario of price breakout to the positive side, XRP could climb.
Confluence of Resistances
XRP’s price has been severely resisted at points $0.213 and $0.244. This $0.244 level was last seen in the first week of March when the cryptocurrency market witnessed subsequent rallies. Interestingly, this point was also where the 200-day moving average currently stood.
The formation of a rising wedge pattern over the course of two weeks, the death cross and the diverging gauge of the moving averages pointed towards a potential bearish breakout in the near-term. The target points for this trend stood at $0.131, meaning a depreciation of 23.37% from the current price. However, in an unlikely case of a trend reversal, the target points for the coin stood at $0.213 and $0.244.