
Having maintained its value above $0.25 for most of 2019, XRP’s dip below the mark gave birth to alarm bells throughout the community, a community that had already been in a frenzy before the ~17.5% drop to $0.178 in mid-December. At the time of writing, XRP was priced at around $0.19 and realistically, could move either way from this point onwards.
XRP 1-hour chart
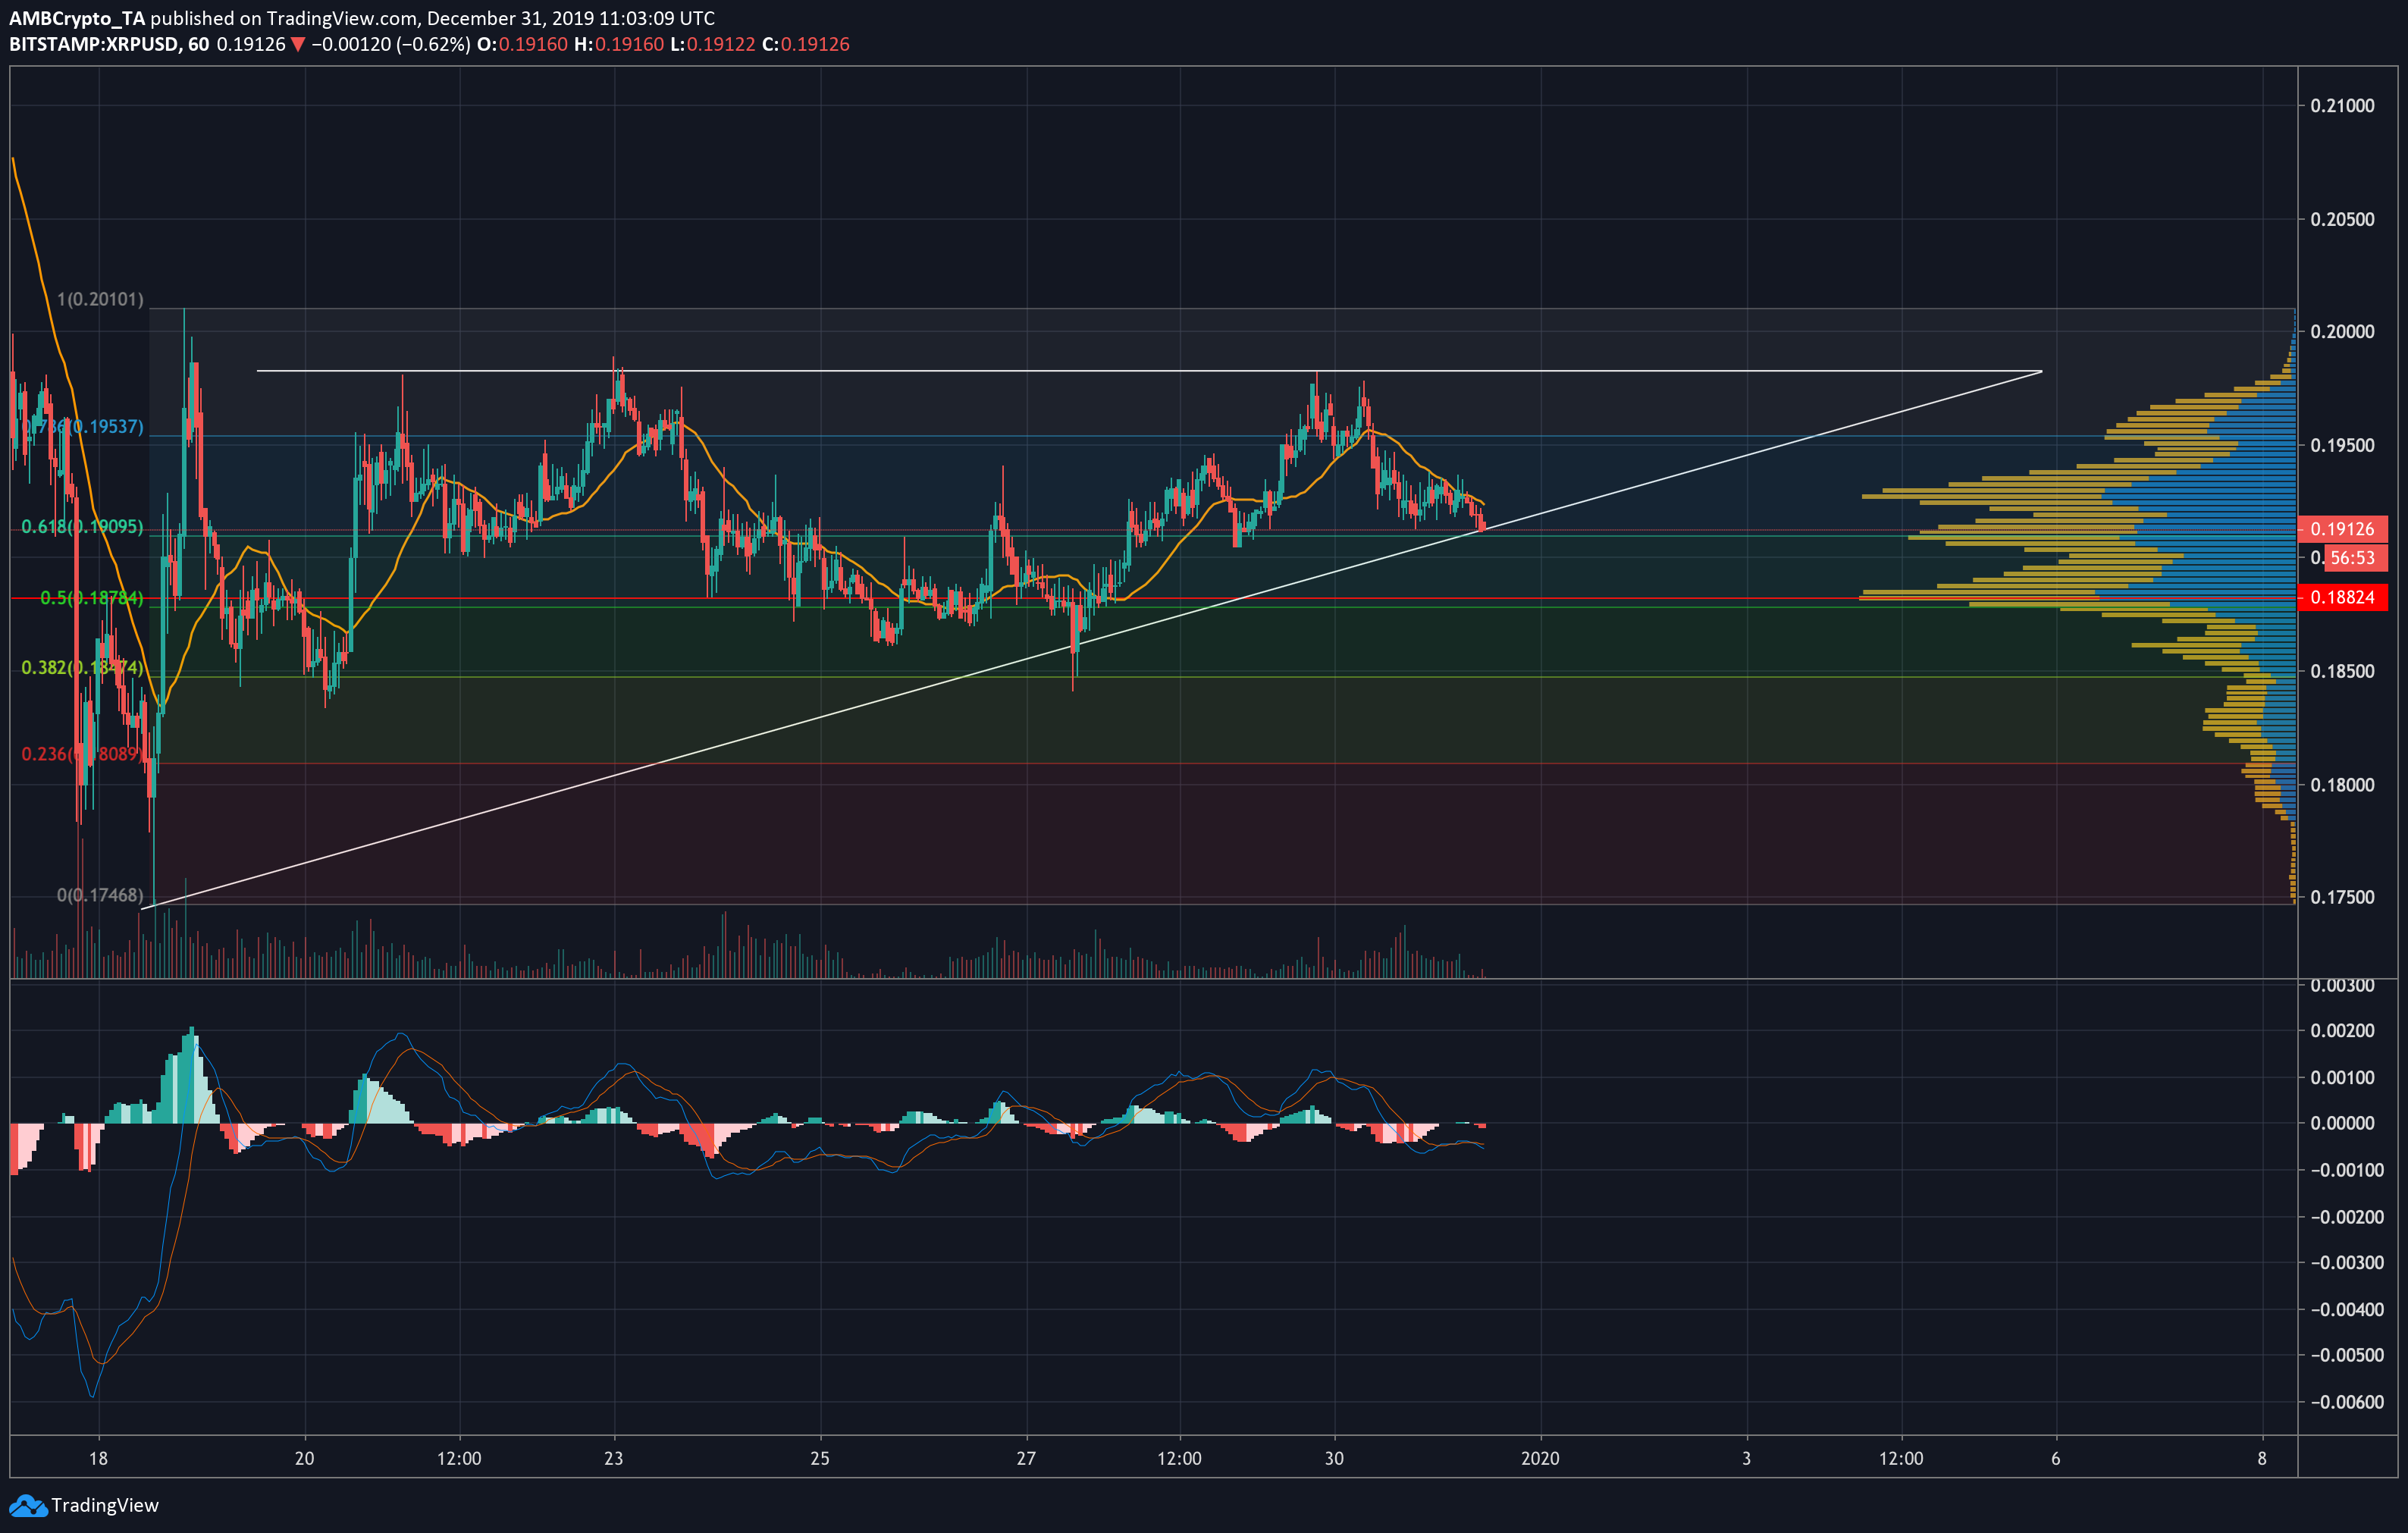
Source: XRP/USD on TradingView
Almost two weeks ago, XRP entered into an ascending triangle formation, complete with an accompanying decreasing trend in volume, as seen in 80% of all cases. These patterns breakout upward over 60% of the time, making a more compelling case for a move upwards in XRP’s value for the short-term. The 21-hour moving average could be seen just above the price line, indicating a slight bearish market at the time of writing. However, this also gives XRP the chance to cross above it.
XRP was seen testing the 61.8% Fibonacci retracement line. However, previous attempts to cross under the line were accompanied by spikes in trade volume. This does not seem to be the case presently.
XRP 4-hour chart
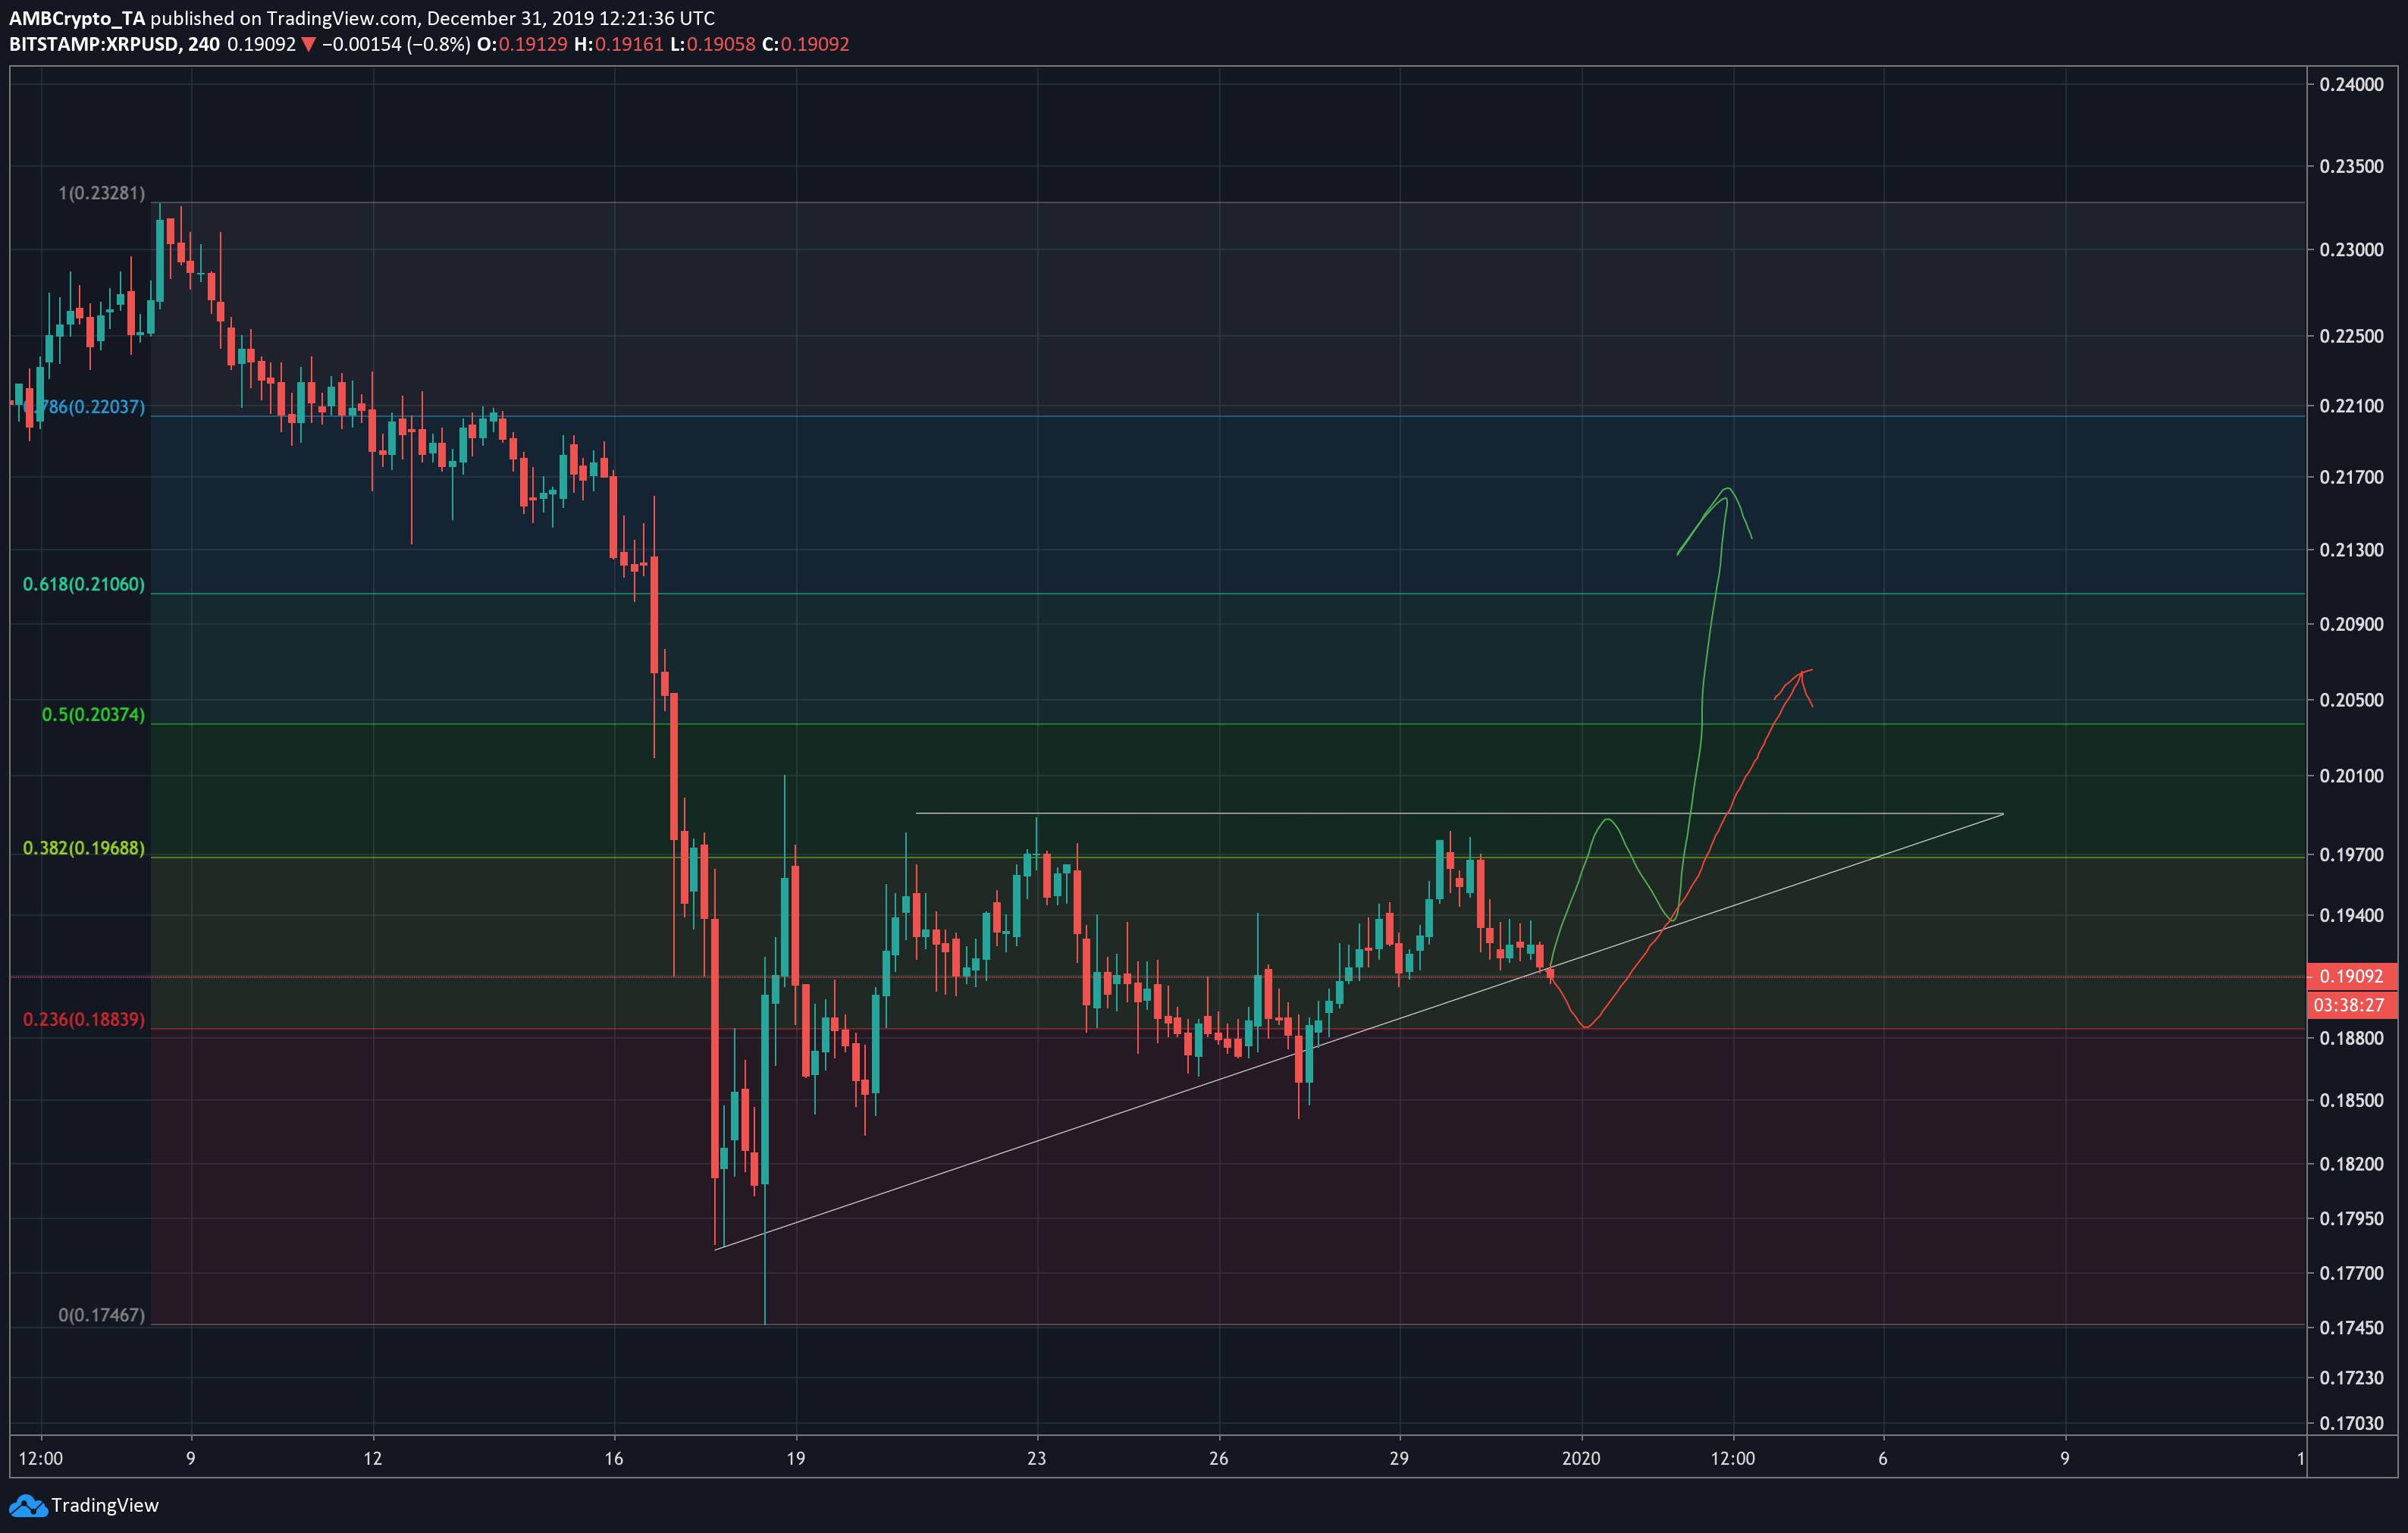
Source: XRP/USD on TradingView
A look at the 4-hour chart shows two possibilities for XRP. The first one, shown as the green arrow in the chart above, could see a potential rise to the 61.8% Fibonacci retracement line, above $0.21. Since ascending triangles tend to push the price up eventually, even a dip to the 23.6% line at $0.188 could lead to a bounce-back into a bull movement. However, this rise will not be able to perform as well as a direct move upward, and could only see the price gaining up to $0.205.
Conclusion
A downward breakout for XRP would see an immediate drop to the Point of Control line on the Volume Profile, to around $0.188, and it could further drop to $0.181 if the bearish momentum continues. With peaks and valleys both surrounding the current price on the Volume Profile, it’s difficult to tell how changes in trade volume will affect the price. If XRP tests the pattern boundary into a bullish movement, it could move up to test the 78.6% Fibonacci retracement line, breaking out upwards to $0.216 by the second week of January.