XRP

XRP breaks out of descending triangle as short-term prediction suggests further slump in price
Posted:

The price of XRP has been taking a hit since the fall of Bitcoin, and has been trading around $0.26. After the price broke on August 14, XRP had been observing alternate red and green candles, showing no sign of absolute recovery. Short-term prediction of XRP indicates a bearish pattern with no sign of relief.
12-hour chart

Source: Trading view
12-hour chart of XRP highlights breaking of a Descending Triangle pattern, indicating a further dip in price. The Descending Triangle extended for 36 days before breaking on the 37th day, noting a fall of 20.08% bringing the price of the coin to as low as $0.23. The coin made some recovery as the current price stands at $0.2654.
6-hour chart
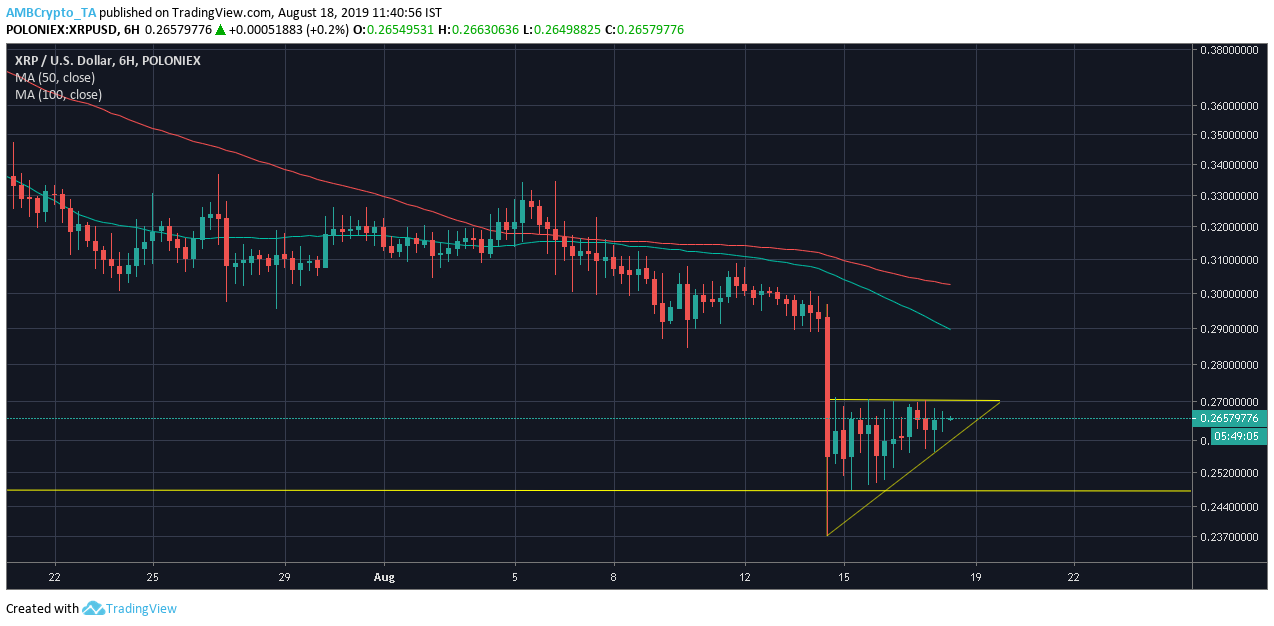
Source: Trading view
As XRP broke the 12-hour pattern, it confirmed the bearish wave as it formed a bearish pennant in the 6-hour chart. The flagpole was formed following the August 14 fall of XRP, after which the price was noted to consolidate, converging into a pennant. According to the feature of this pattern, a breakout could be imminent for XRP taking the price of the coin back to the immediate support at $0.2368. The price has been consolidating over the past three days and could breakout within a couple of days.