
XRP had a great couple of weeks enjoying its upward momentum to levels unseen in recent days. Just when the market anticipated another rally breaching the existing 2020 highs, the market faltered. Bitcoin tumbled just two days before its block reward halving, and the altcoins followed suit. XRP was being traded at $0.198, at the time of writing.
XRP 6-Hour Chart:
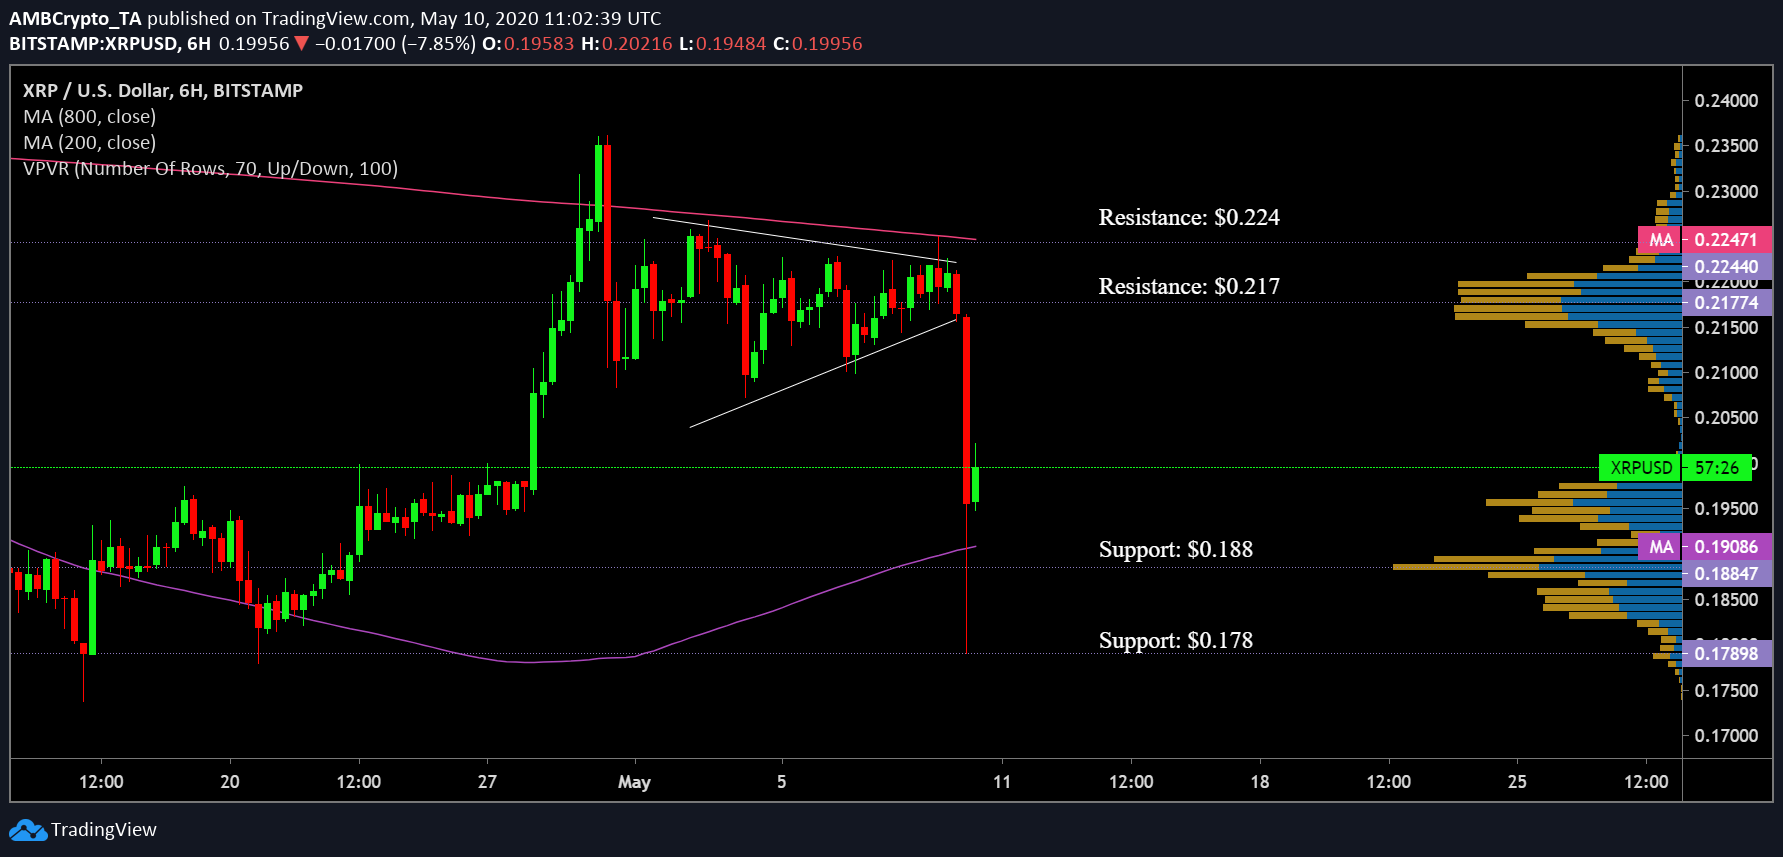
Source: XRP/USD on TradingView
XRP ‘s 6-hour candlestick arrangement was found to be oscillating between a symmetrical triangle pattern. This was indicative of a breakout on either side. However, as bears weighed in, the coin’s fate took its price down for a deep plunge.
Heavy Resistances
XRP’s price was trapped between the 50 daily moving average [Purple] and the 200 daily moving average [Pink] for nearly two months with the latter hovering well above 50 DMA. The spread between the two appeared to be expanding, however, this trend changed as the coin marched upward all the way to $0.23, and following this price action was the 50 DMA which also moved upward as the gauge declined.
The latest dip has only further strengthened the position of the bull as the coin briefly dropped close to the $0.178.
Meanwhile, price candles were heavily resisted by the daily moving averages. In addition, even RSI dropped well below the 50-median neutral zone and was currently in the oversold region. It dropped to a level not seen since the third week of March right after the crash. The RSI bounced back after touching the lower band but exhibited a sentiment of high sell-off in the market.
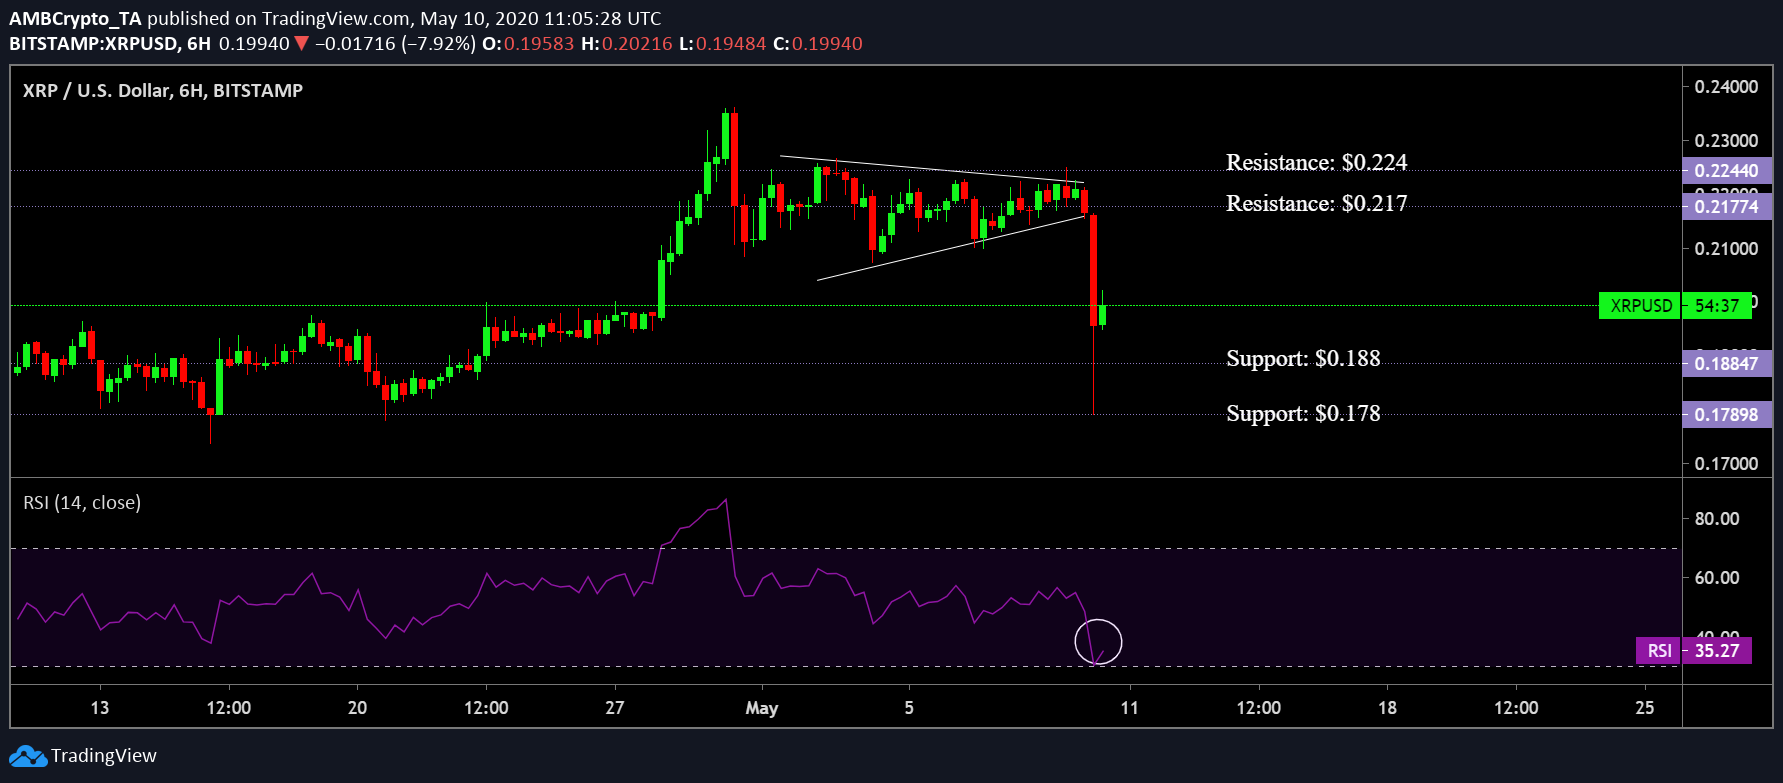
Source: XRP/USD on TradingView
Scenario 1:
A further breakout on the bearish side was observed to be a potential outcome in the coming days. If this materializes, the coin could test the previously held support at $0.188, a level in which extensive trading was noted by the VPVR indicator. A further pullback will take the coin all the way to its March-April lows of $0.178
Scenario 2:
A bullish reversal appeared bleak with the indicators pointing further downside correction. VPVR indicated a heightened trading activity in the previously consolidated price range where the first resistance point was found, i.e., $0.217. The 200 DMA also resisted the XRP price candles at point $0.224.
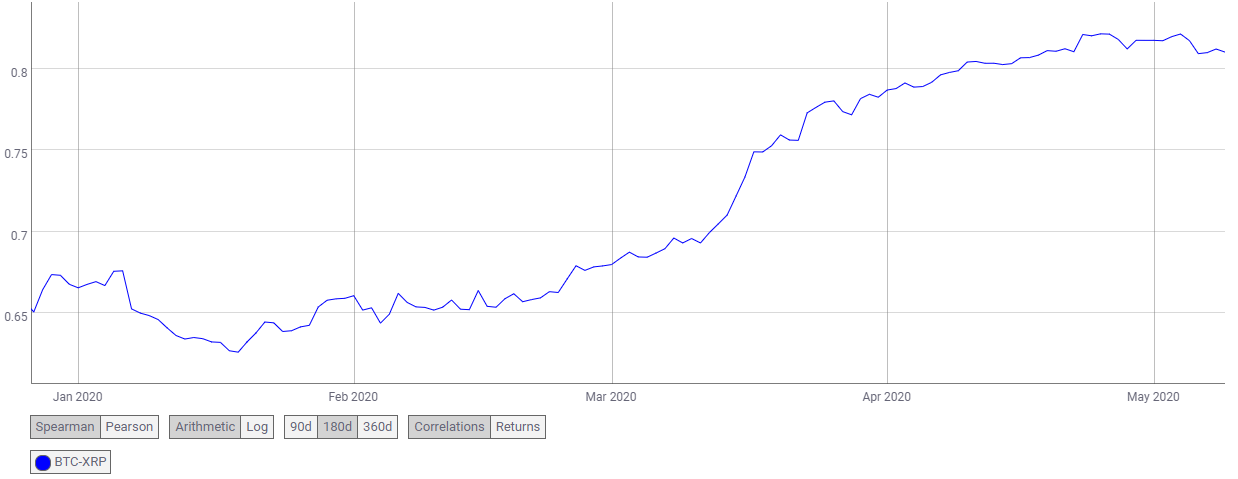
Source: Coin Metrics
The XRP-BTC correction coefficient stood at $0.81 and has been increasing for the last couple of months. This implied that if Bitcoin fails to rise above its crucial resistance point, this could further add to the downward pressure for all the alts including XRP, leading to an exaggerated price drop in the coming days.
Conclusion:
The placements of 200 DMA and 500 DMA, as well as the high sell-off indication by the RSI, indicated a downward price breakout, testing $0.188 and $0.178 points while the coin found heavily resisted at levels $0.217 and $0.224.