
Ethereum made a retreat to $189 after the latest price plunge. The price of the largest altcoin, ETH had turned red following the increasing downward pressure. It appears that ETH’s tryst above the $200-level was short-lived as significant gains were wiped following the drop. In addition, the market indicators are pointing towards a risk of further decline.
Ethereum Daily Chart:
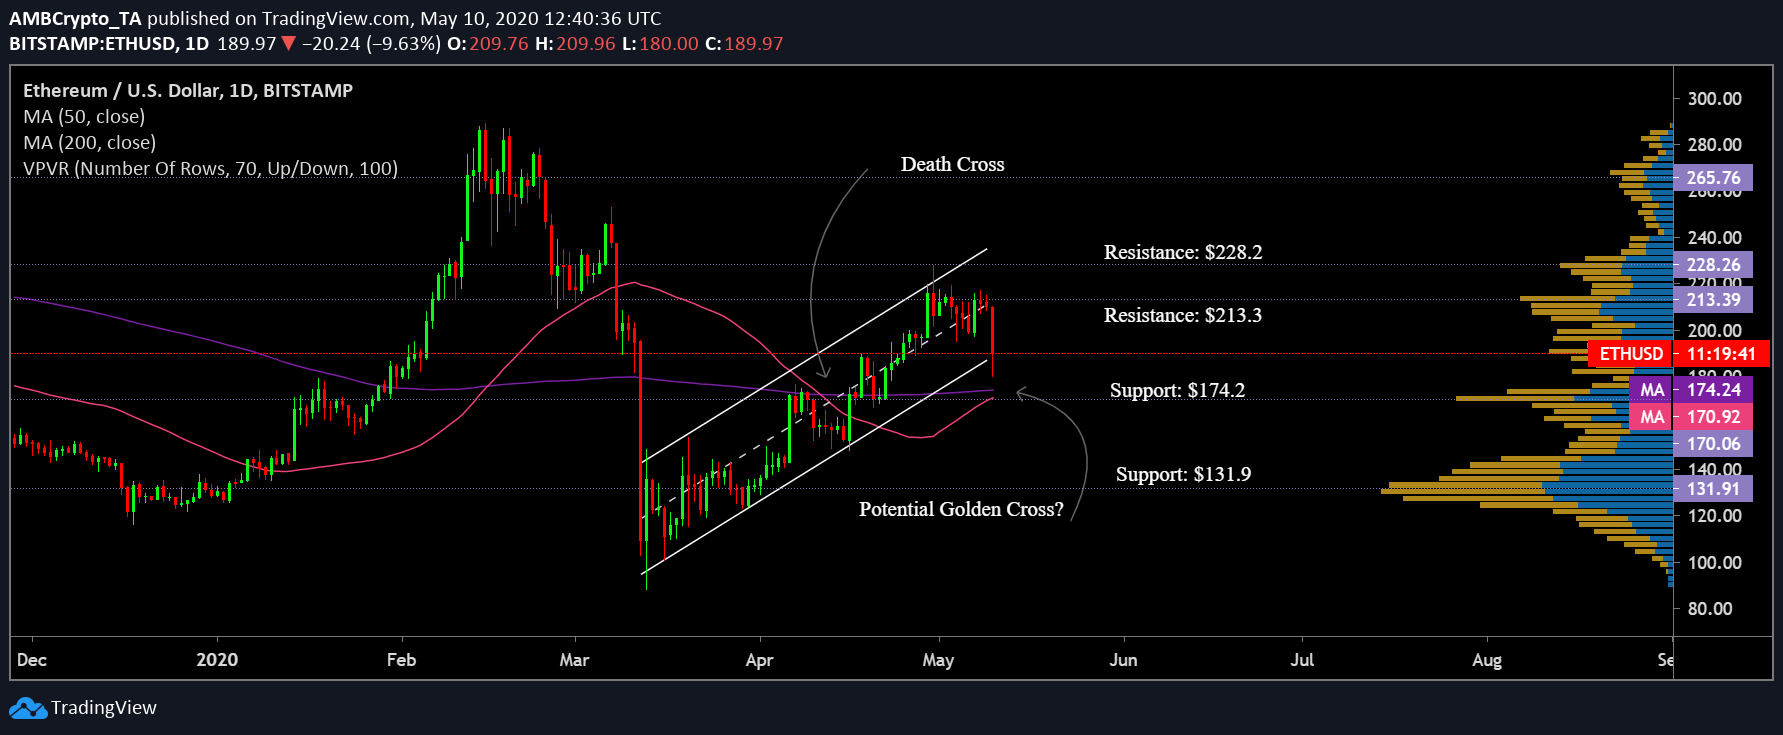
Source: ETH/USD on TradingView
Ethereum’s price has maintained a steady uptrend after the crash on 12th March. This resulted in the price candles following an ascending parallel channel pattern, a breakout of which took place in the wee hours of 10th May. Rightly so, in line with the pattern formation, the price sustained a bearish breakout.
It appears that the worst is not yet over and ETH could potentially inch closer to breach its previously held support points.
Turn of events
The 50 daily moving average [Pink] slid below the 200 daily moving average [Purple] after a death cross which took place nearly a month after the fateful crash of March. Following a continuous upward momentum, the two daily moving averages, which for a long time where resisting the ETH price candles, now settled below it. This indicated a positive trend in the offing. Further, the 50 DMA also noted a shart spike and the spread between the two DMAs declined substantially, this suggested that a golden cross could be unwinding in the near-term.
However, the latest crash pointed that a bullish trend could be muted here.
This was supported by the MACD indicator which projected a bearish phase for the coin. To top that, RSI was observed to be heading deeper in the oversold region which was indicative of a rising sell pressure in the market.
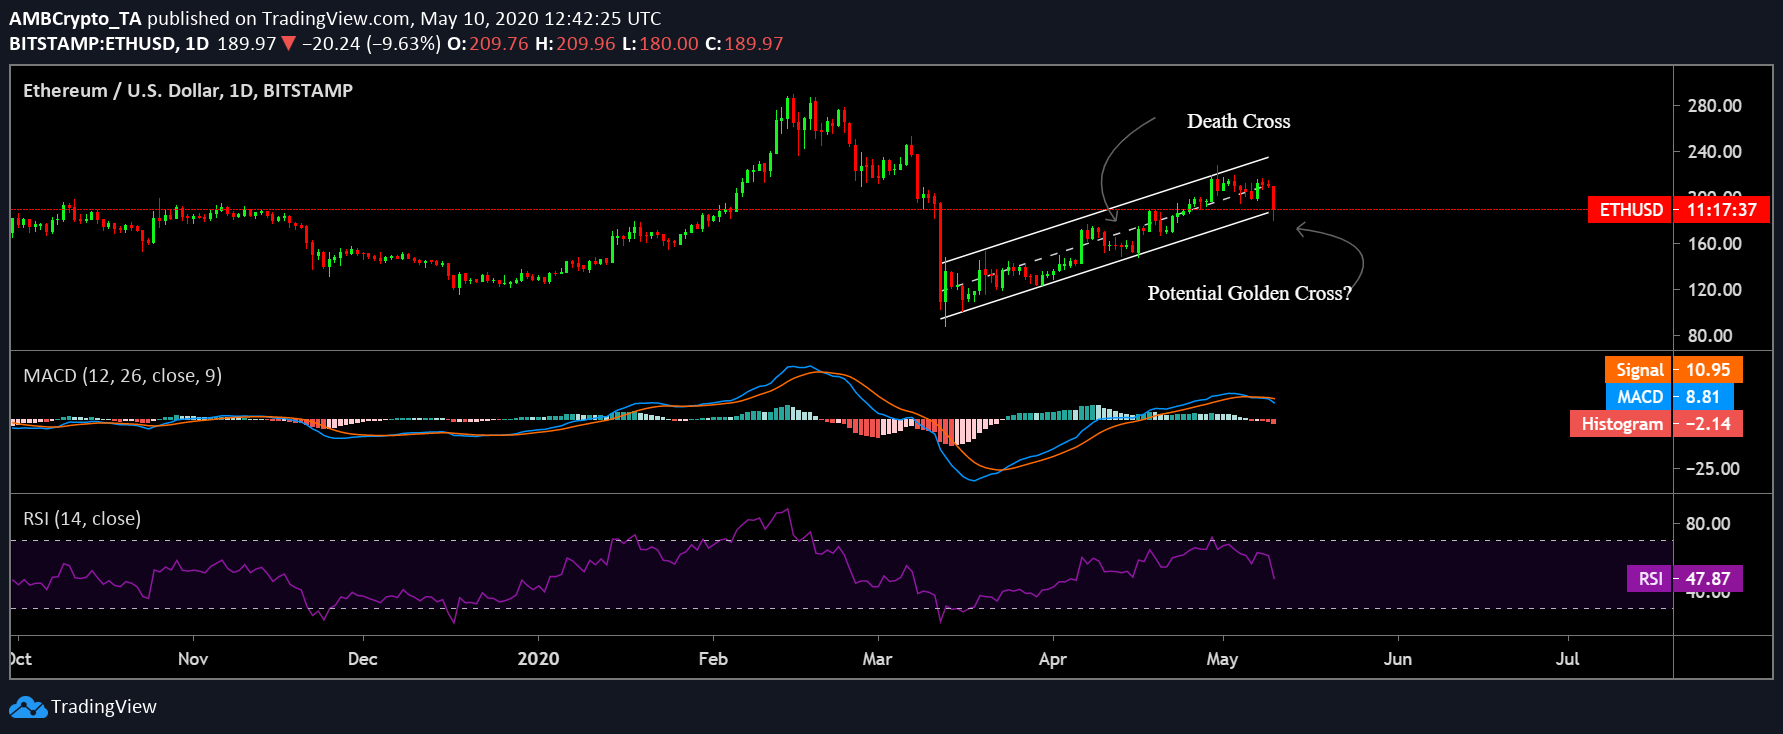
Source: ETH/USD on TradingView
Case 1:
If the indicators and the moving averages are taken into account, it appears that further downward breakout is imminent. The target point in this scenario stood close to the convergence of two moving averages as well as a high trading activity recorded by VPVR indicator at $174.2. If the downward pressure persists, the coin could find its price retracing to another target point at $131.9, a level where the VPVR depicted an intense trading activity.
Case 2:
Chances of a reversal in this trend looked highly unlikely. Nonetheless, the target points for the coin stood at $213.3 and $228.2 respectively.
Decoupling?
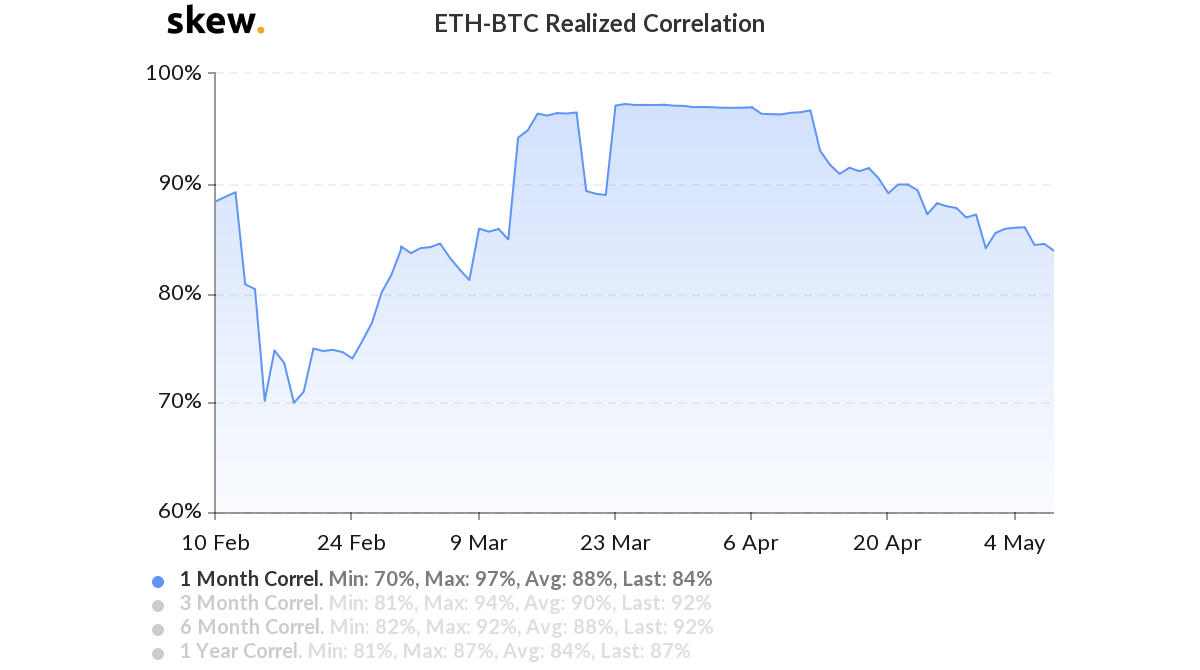
Source: Skew
According to the latest Skew charts, the ETH-BTC 1-month correlation has declined as it dropped to 84%. If the decoupling continues, then it would be tough for Ethereum to tread higher, at least in the near term.
Conclusion:
With the support of market indicators such as MACD, RSI as well as daily moving averages, it can be concluded that the near-future still looks gloomy for the second largest coin. If this negative trend materializes, ETH could drop to levels $174.2 and a subsequent $131.9 if the bearish momentum weighs further, while an uptrend to $213.3 and further up to $228.2 does not seem likely.