
Bitcoin’s dominance continued to rise at press time, with the same noting a figure of 63.97%. Monero, one of the market’s premier privacy coins, had been moving sideways over the past couple of weeks and could be set to continue to do so over the next week or two. VeChain was trading just above an important level of support, while Augur broke beneath a region of support and could be headed lower on the charts.
Monero [XMR]

Source: XMR/USDT on TradingView
Monero has been trading within the range between $120 and $135 for a few weeks now. The 50 SMA (yellow) and the 100 SMA (pink) were moving quite close to one another after September’s strong uptrend.
This pointed to the possibility that Monero will continue to trade within this region in a phase of consolidation. However, at the time of writing, the price had moved under the 100-period moving average and could be headed to $120 once more.
Further, the RSI also noted how the past few weeks did not have a predominant trend for the crypto-asset.
VeChain [VET]
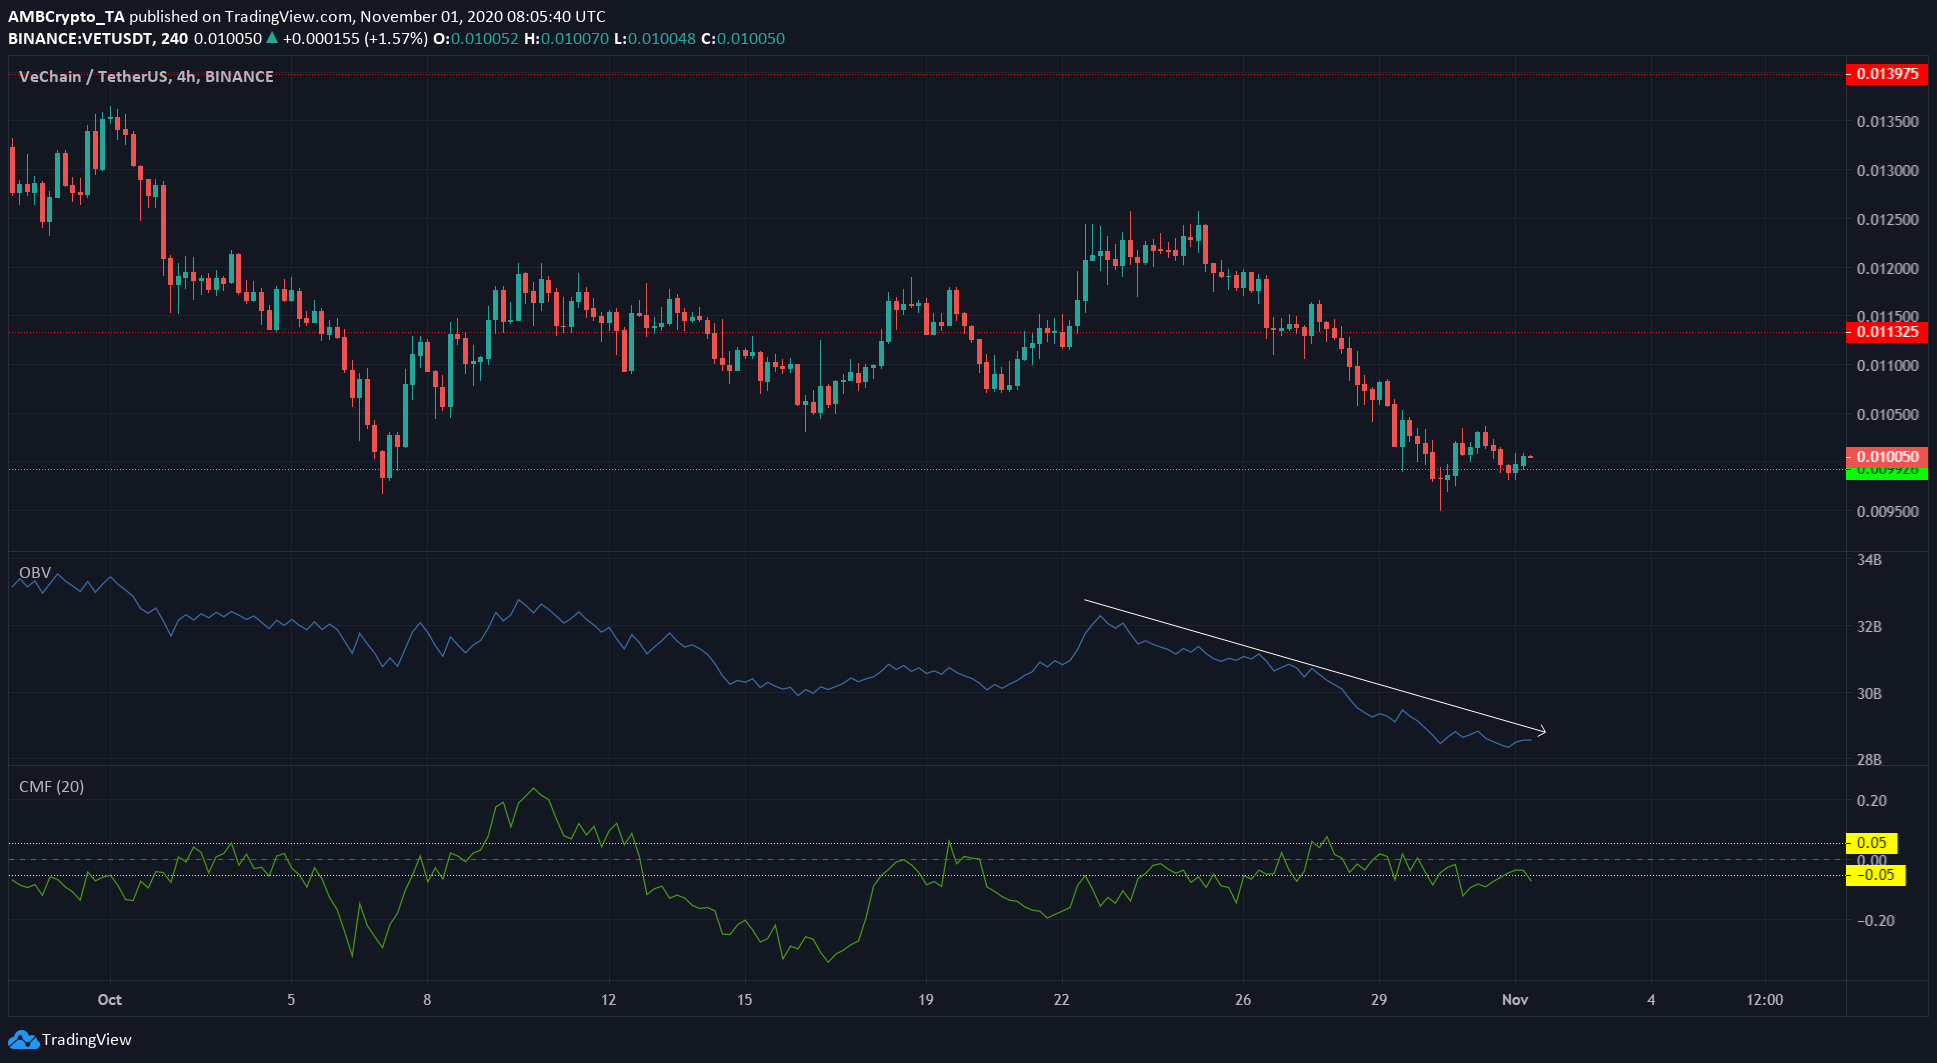
Source: VET/USDT on TradingView
VeChain was facing steady selling pressure. The CMF showed that over the past few weeks, there were periods when capital flowed strongly out of the market. Further, the OBV also showed that buying volume was overwhelmed by the sellers in the market.
The same was also accompanied by VET losing the $0.0113-level and finding support at $0.01 once more. A drop under $0.01 can see VET move toward $0.0091, the next level of importance.
Augur [REP]
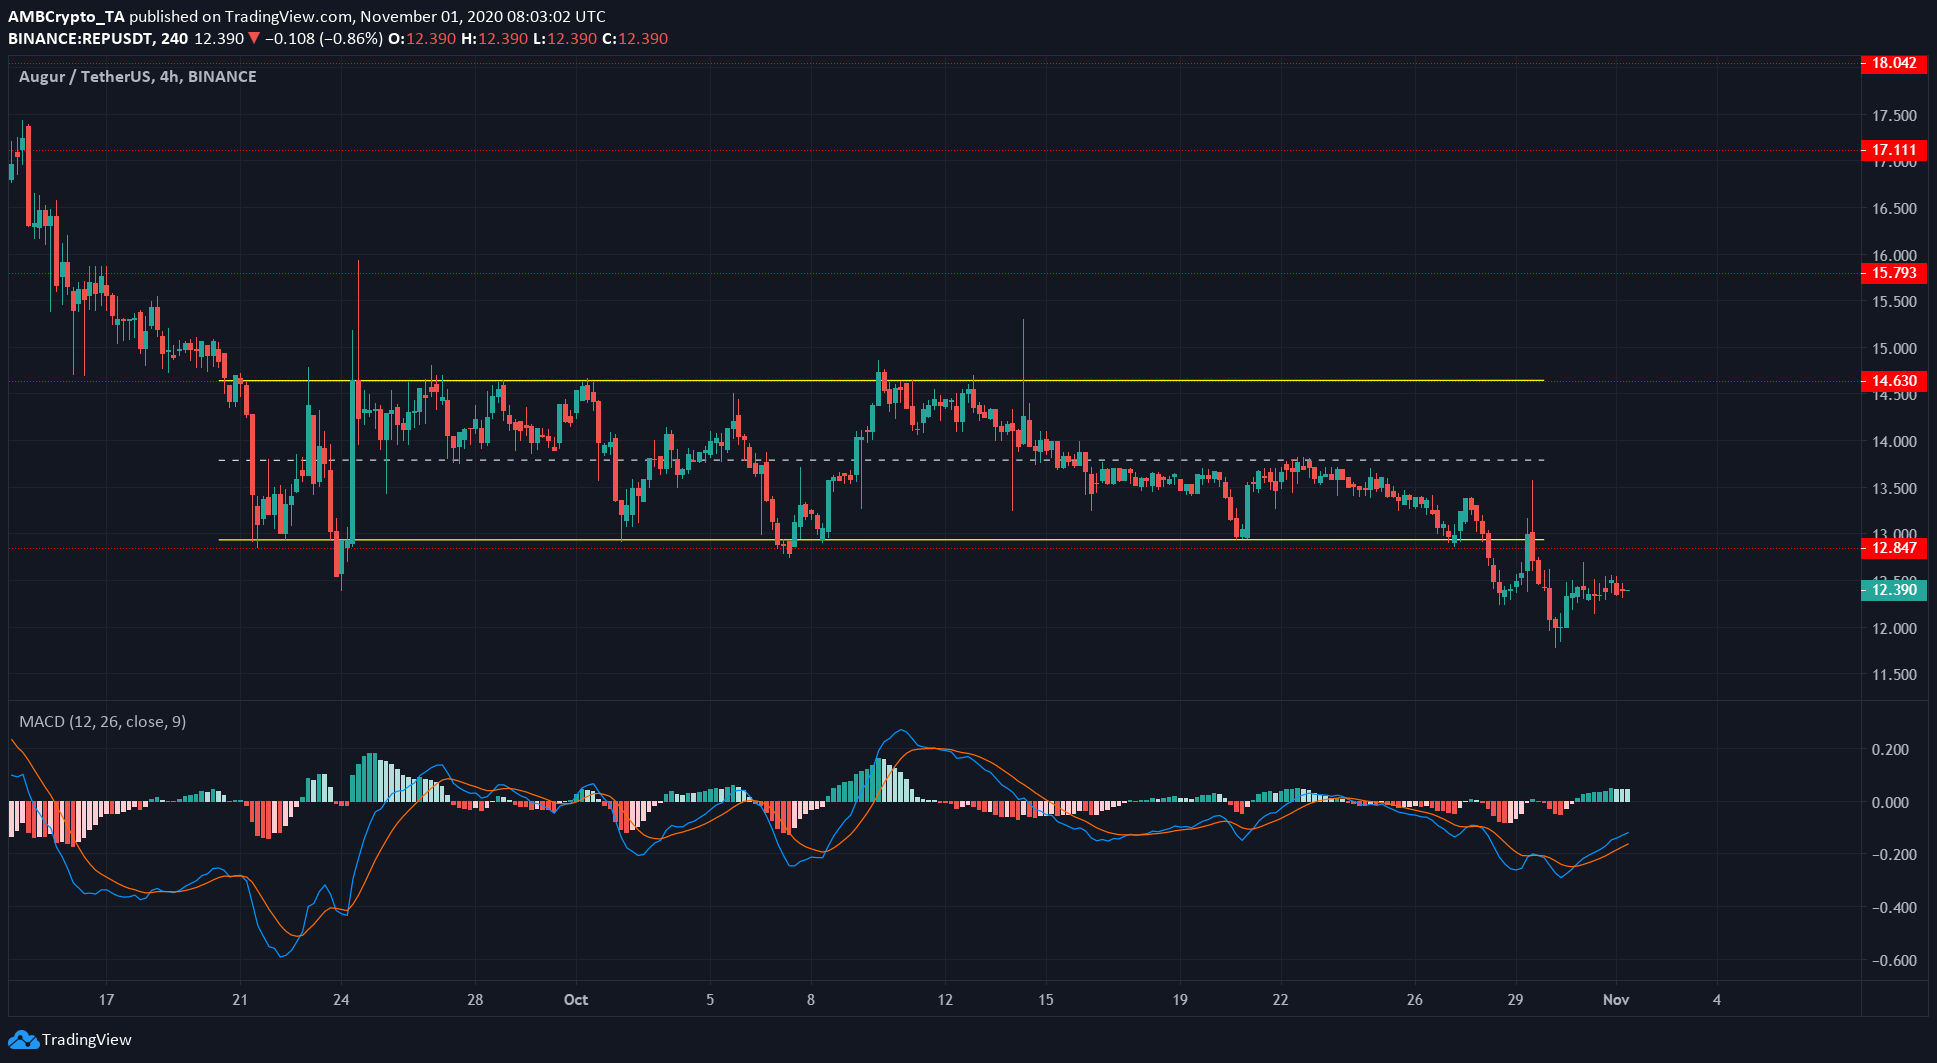
Source: REP/USDT on TradingView
REP was trading within a rectangle bottom last week and broke beneath the pattern over the past few days.
The price pulled back, however, to test the rectangle’s lower boundary. This indicated that the price, which could be projected to reach $10.8 following a breakdown, was unlikely to drop so low. A more conservative target could be between $11.5-$11.7 if REP headed south once more.
The MACD formed a bullish crossover under the zero line, indicating a weak buy signal. However, the recent trend has been bearish, and unless the resistance level at $12.84 is flipped to support, REP would not have a bullish outlook.