Tron, BAT, VeChain Price Analysis: 19 June

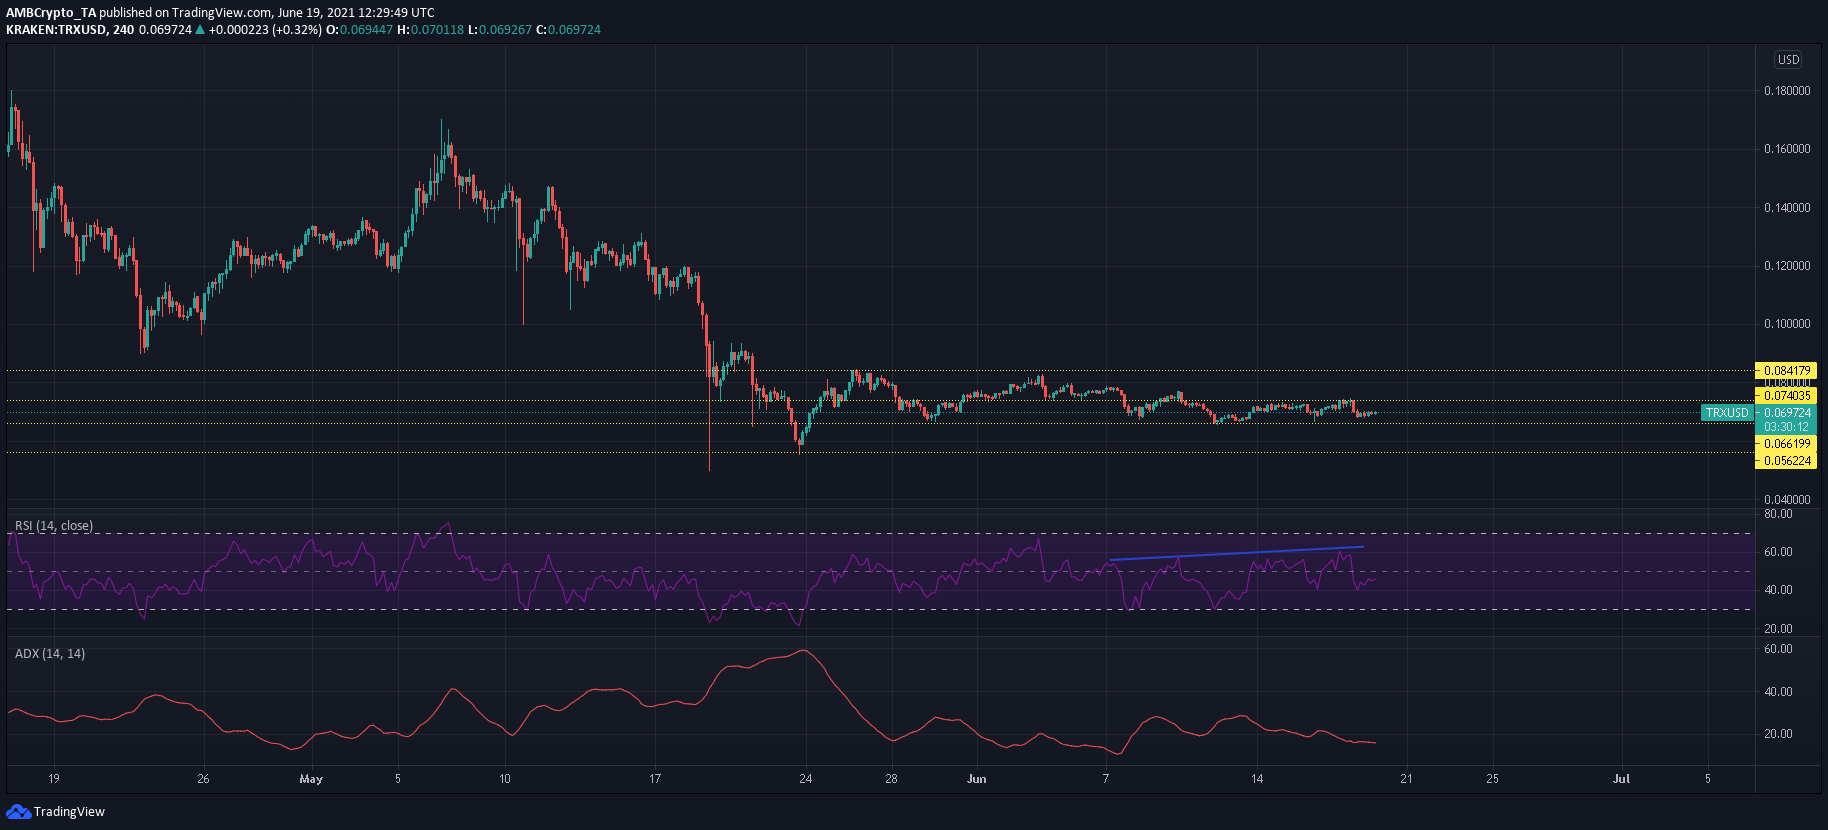
With Bitcoin hovering just above the $35,000-mark, the broader altcoin market found itself in a scurry. Altcoins such as BAT and VET did trim some of their losses over the last 24 hours, but bears were still dominant in each of their respective markets. While TRX also noted selling pressure, the RSI’s bullish divergence induced some optimism with respect to its short-term trajectory.
Tron [TRX]

Source: TRX/USD, TradingView
An ADX reading of 15 suggested a weak trend in Tron’s market as the cryptocurrency maintained its channel of $0.074 and $0.066. Huge price swings were unlikely considering low volatility and TRX would likely oscillate between the aforementioned region over the coming sessions. While the RSI traded in neutral territory at press time, its uptrend was an interesting development. Not only did the index show a bullish divergence with respect to the price, but also pointed to stronger price action in the near future.
A hike above the $0.074-resistance would see the cryptocurrency head towards its next ceiling at $0.0841.
Basic Attention Token [BAT]

Source: BAT/USD, TradingView
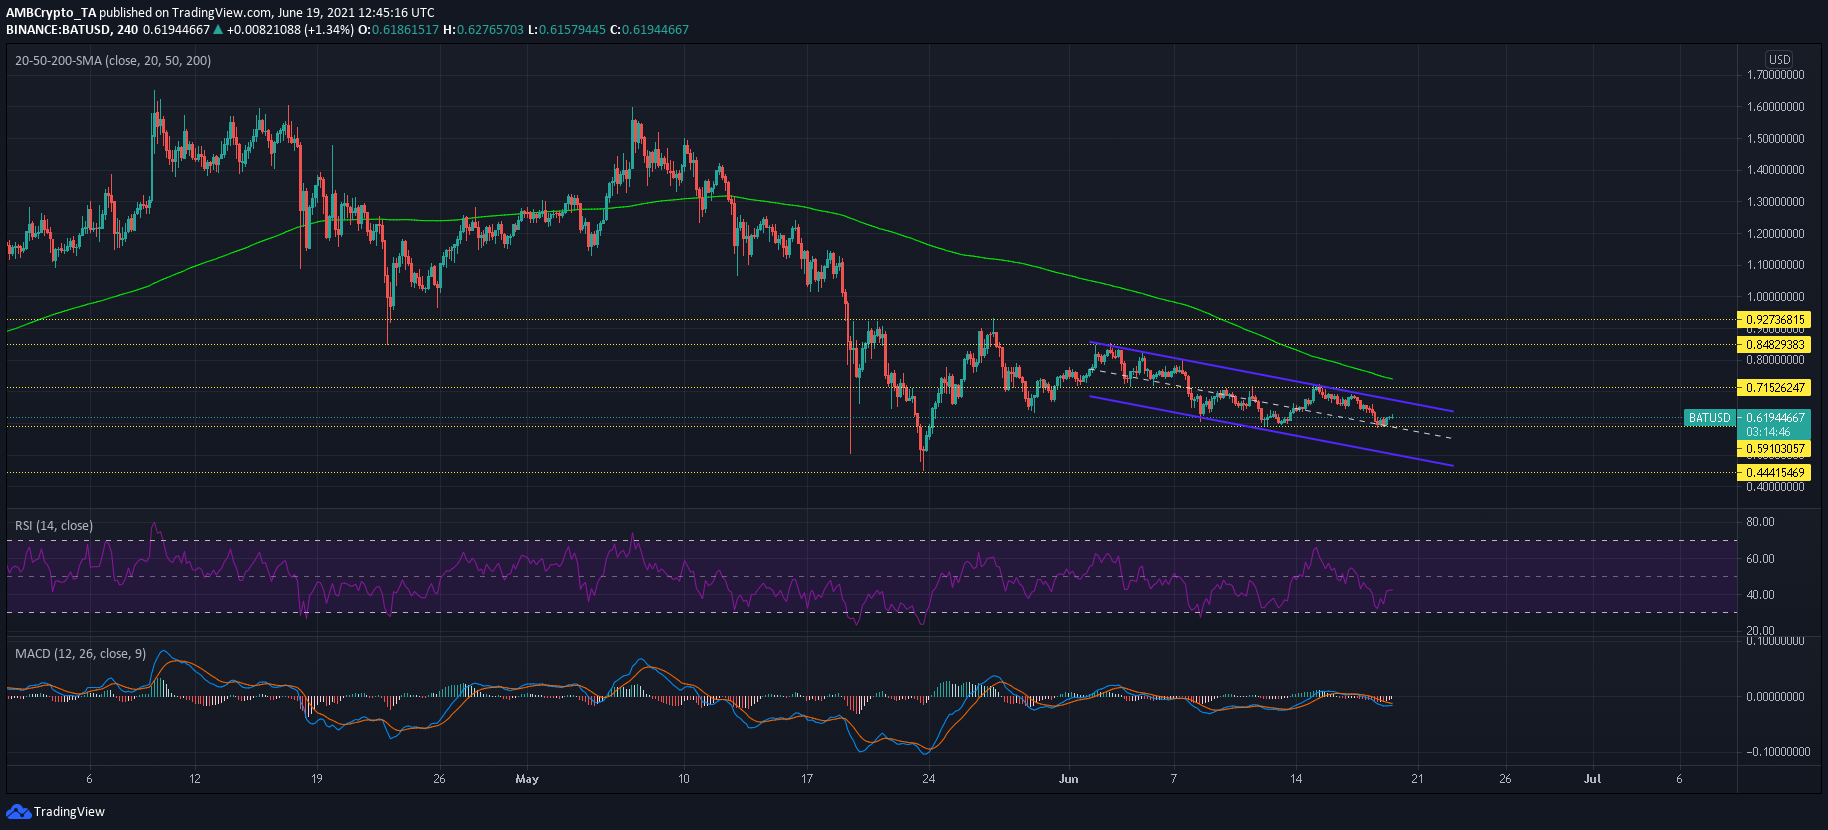
At the time of writing, Basic Attention Token seemed to defend the $0.591-support as focus shifted to the upper trendline of its down-channel. The RSI highlighted oversold conditions in the market, but recovered over the last few sessions. The MACD closed in on a bullish crossover as well. However, these cues were not enough to warrant a breakout from the pattern especially since the 24-hour trading volumes were on the weaker side.
Moving forward, expect BAT to oscillate between its channel once it reaches a strong support level. In case of an early breakout, the target can be set just above the $0.715-resistance and near the 200-SMA (green).
VeChain [VET]

Source: VET/USD, TradingView
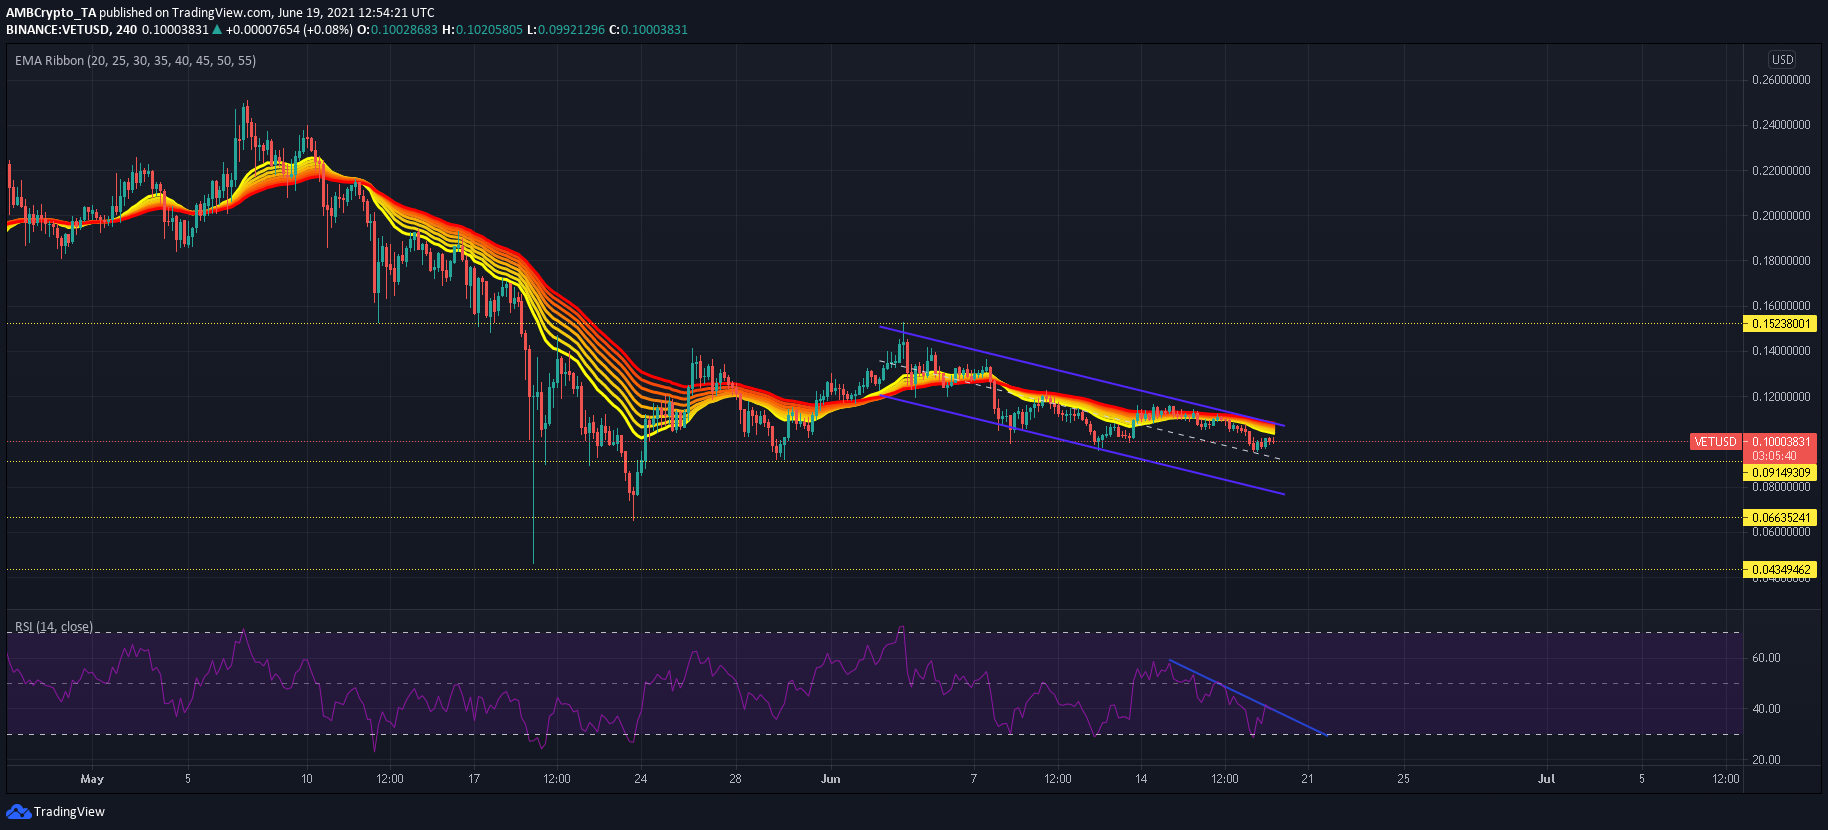
VeChain’s movement was also within the confines of a descending channel but a breakout did not seem likely in the near future. The constricted nature of VET’s EMA Ribbons suggested sideways movement and an active bearish trend. Moreover, the RSI pointed south and it could trade in the oversold region once again over the coming days.
VET’s defensive lines rested at $0.091 and further down the charts at $0.066. Both these areas had the potential to trigger a breakout, but broader market movement would likely dictate the direction of huge price swings.


