
Disclaimer: The findings of the following analysis are the sole opinion of the writer and should not be taken as investment advice
Bitcoin’s dramatic surge to ~$16,000 was a good run, however, the fuel seemed to have exhausted itself, with the market’s bulls now running on fumes. At press time, BTC was trading at $15,142, $800 below its local top. Interestingly, the present scenario was pretty bullish, even though the said bulls were running on fumes.
Overall, the HTF/larger setup seemed to be bullish, but in the short-term, not so much. Before getting into the short-term, let’s take a look at the HTF of the 2-day Bitcoin chart.
Bitcoin 2-day chart
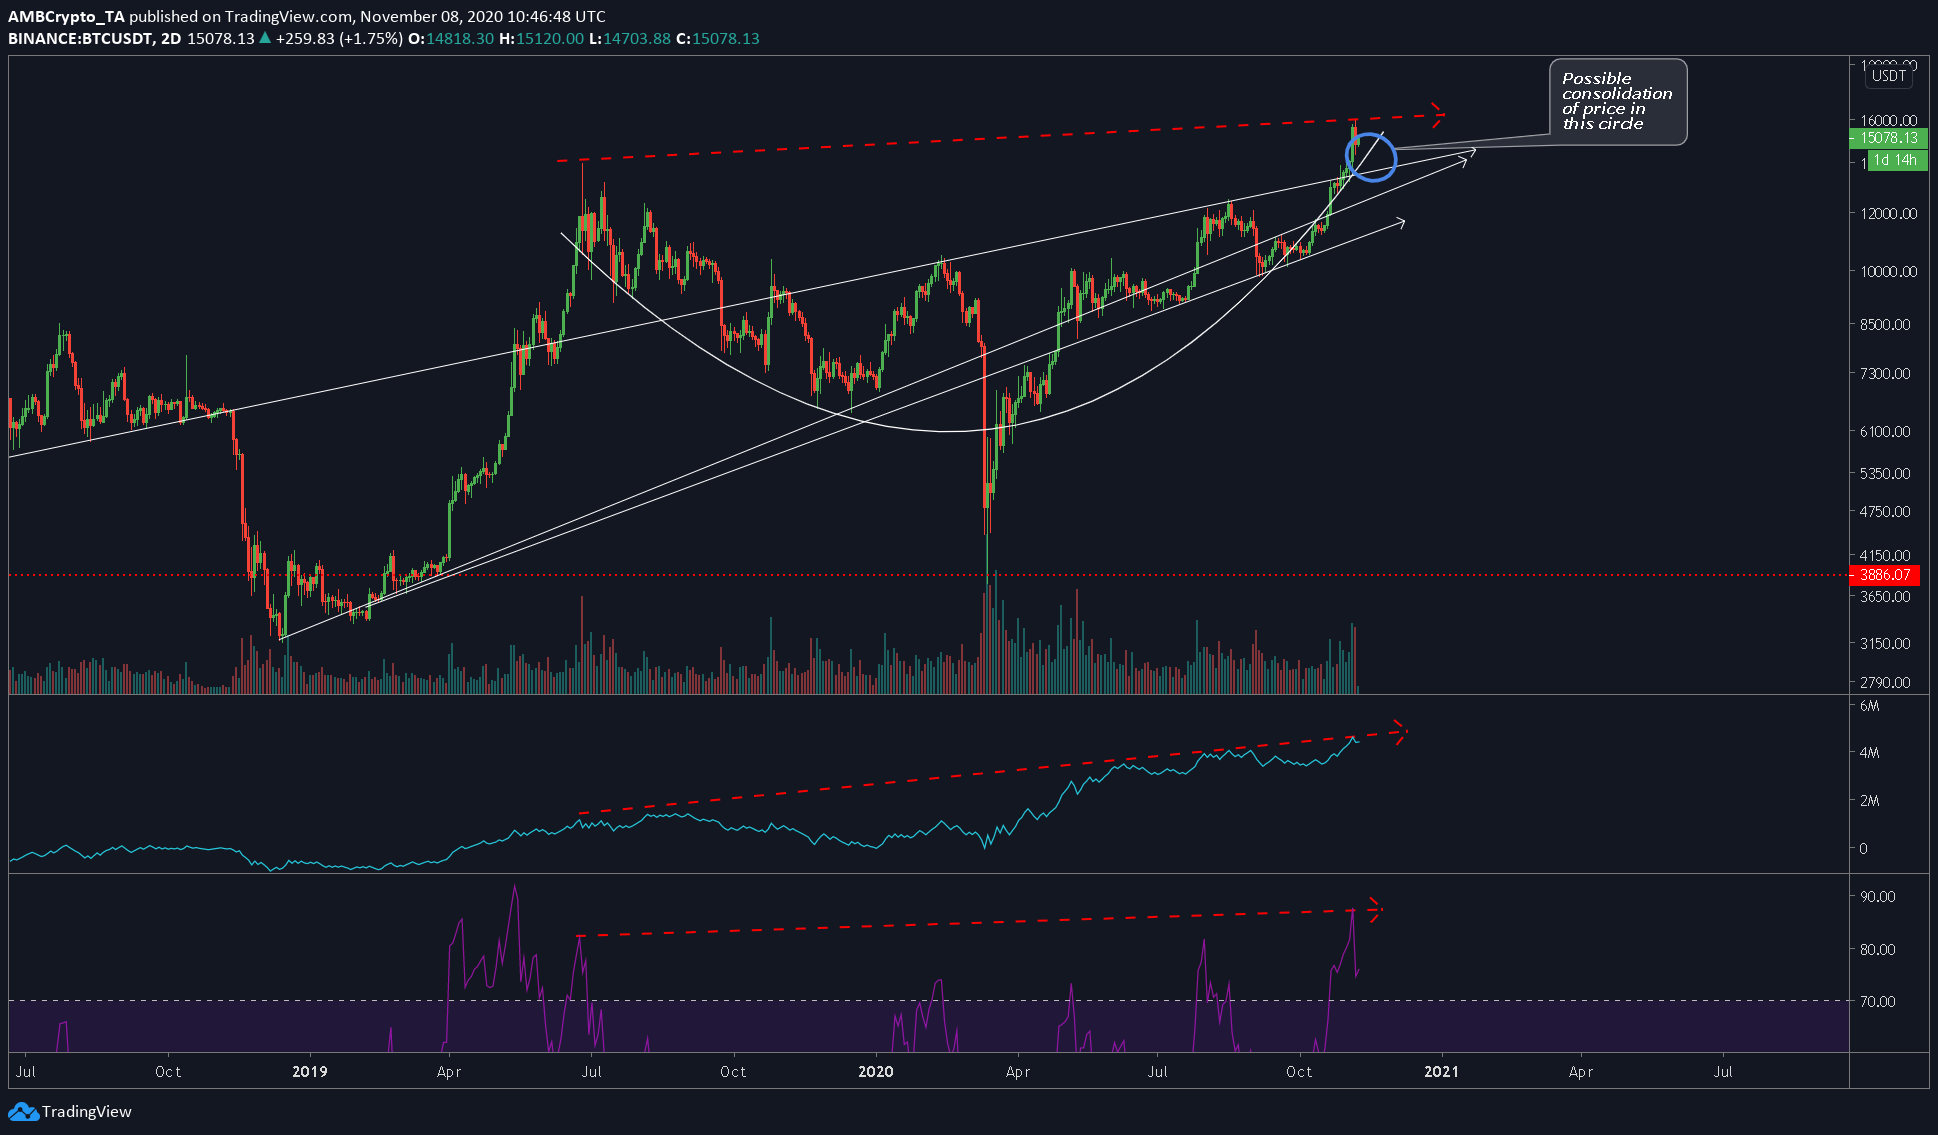
Source: BTCUSD on TradingView
The 2-day chart for Bitcoin has multiple trendlines [white and red lines]; the white ones are trend lines and red dotted lines are used to determine divergences between the price and indicators, if any.
The top-most trendline stretches all the way back to late 2018, with the price being supported by this line during the first rally in 2019. Judging by the way this trendline has extended itself, it could very well support the upcoming Bitcoin pullback.
The other two trendlines extend from the bottom of the March crash.
Between the price and volume [OBV indicator], there is a positive confirmation of the recent price surge. The same can be seen when observing the RSI.
Other aspects include the rounded bottom, with the price peeking out of this pattern during the March crash. For now, we can expect a pullback, one that will likely happen inside the circle drawn above and bounce from the top-most trendline mentioned previously.
Bitcoin 1-hour chart
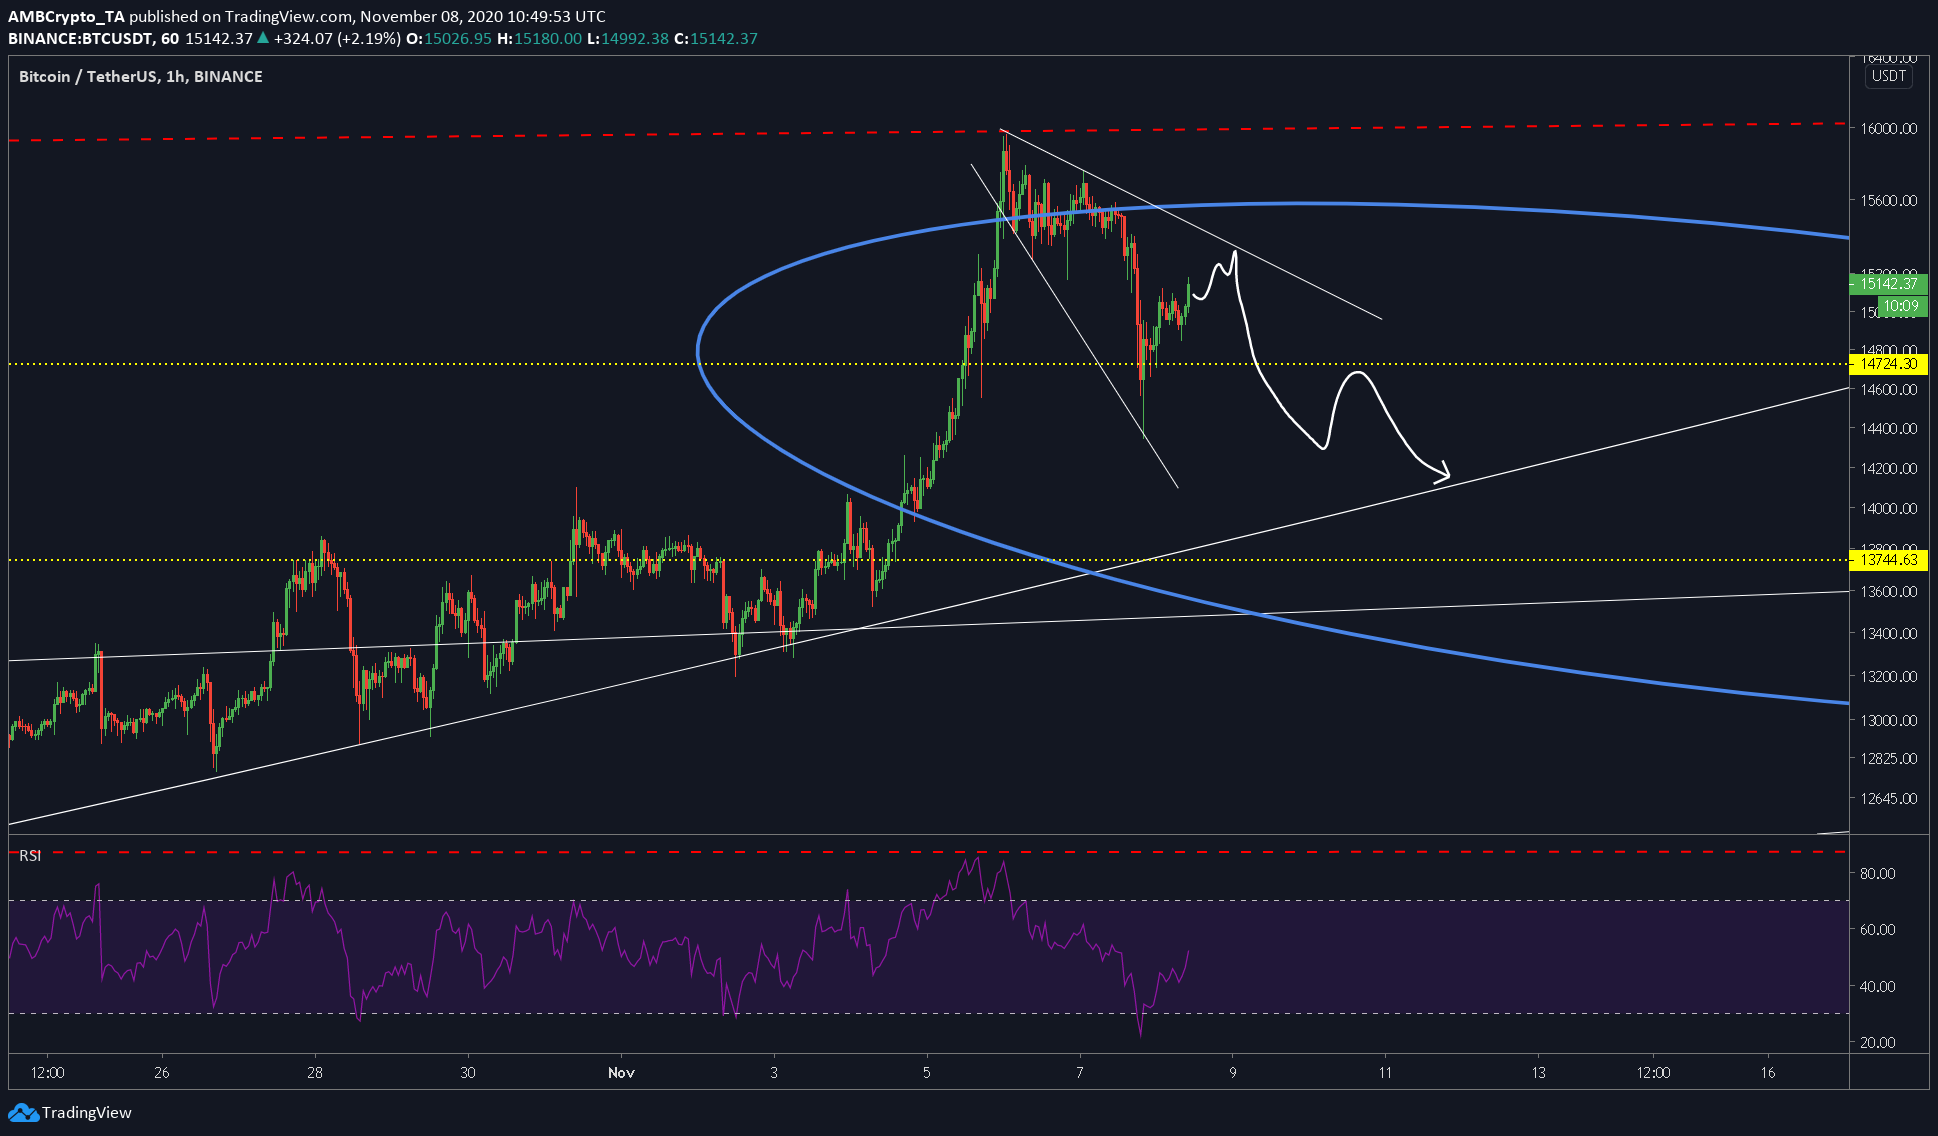
Source: BTCUSD on TradingView
The attached chart is the magnified version of the HTF chart mentioned previously.
Rationale/Conclusion
Over the shorter time frame, we can see Bitcoin forming a broadening wedge. While the price might be surging, for now, it will fall as it hits the top of the broadening wedge, a development that will push the price lower.
Apart from the top of the broadening wedge acting as resistance, we can also see that the RSI indicator has space to move to the overbought zone, something that explains Bitcoin’s surge up to the top of the broadening wedge.
Rejection at this level would push the price of the cryptocurrency down.


