Bitcoin short-term Price Analysis: 04 October

Disclaimer: The findings of the following article are the sole opinion of the writer and should not be considered investment advice
After CFTC brought charges against BitMEX for allegedly violating the Bank Secrecy Act, Bitcoin tumbled down the charts and fell by 4%. However, BitMEX took a much harder hit as its OI has since collapsed by 25%. Either way, Bitcoin seems to have absorbed the news without a huge spike.
Could this be the liquidity institutions are bringing along? Perhaps, the market has become desensitized to developments such as the CFTC’s charges against crypto-companies. Even though Bitcoin noted just a small drop, its price did manage to stay within the support, resistance lines.
Bitcoin 4-hour chart

Source: BTCUSD on TradingView
The attached chart paints a picture of what to expect from Bitcoin over a medium-term timeframe. At the time of writing, Bitcoin was stuck in a consolidation pattern with higher lows and lower highs. Additionally, it was very close to a breakout point.
We can expect the breakout to be a volatile move backed by enough volume; perhaps, one similar to the move seen in early-September. This could push the price towards the CME gap and may even fill it.
On the contrary, the price could burst out higher and breach the $12,000-level. Anything could happen, and quite frankly, it is too early to call anything.
However, one can easily see that the price was rejected, as evidenced by the yellow line of the Chuvashov Fork, just before the CFTC announcement. This put Bitcoin back on its track, but it soon developed an additional bearish pattern following this rejection.
Bitcoin 1-hour chart

Source: BTCUSD on TradingView
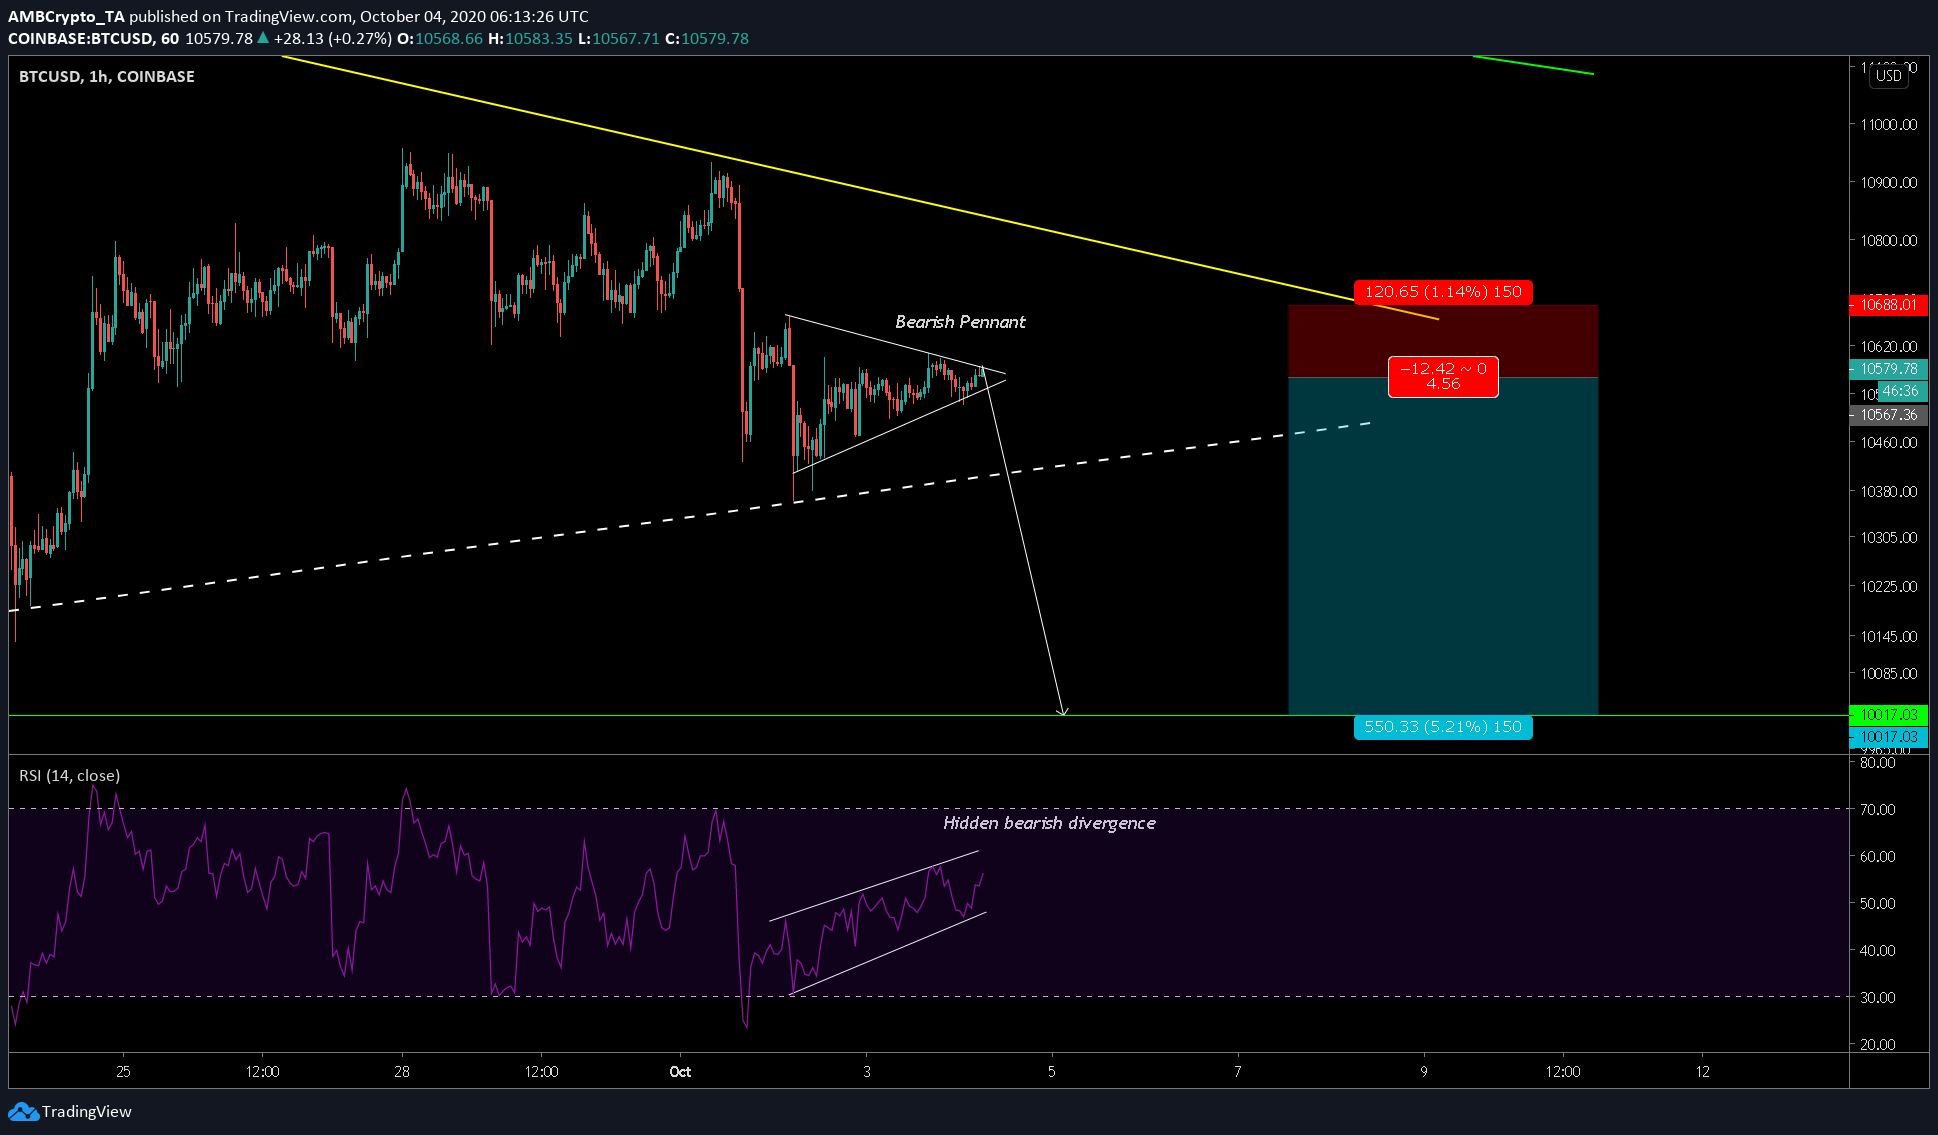
The one-hour chart showed a clear picture of the bearish pattern mentioned above – a bearish pennant aka a continuation pattern. This continuation pattern will push the price in the direction of the price trend – in this case, it was bearish.
A breakout of this pattern will push the price down another 4-5% and the price will touch $10,000. This calls for a good short-trade with an entry at $10,567 and stop-loss at $10,688. Take profit will be at $10,0017 or 5.21% lower from the entry point.
Supporting this short trade was the RSI indicator since it formed a textbook hidden bearish divergence, one where the price formed lower highs and RSI formed higher highs.
All-in-all, this short position would be a good trade yielding an R of 4.56.


