Bitcoin SV, Polkadot, and FTX Token mirrored the bearish sentiment that has gripped much of the crypto-market over the last few days. In fact, the Crypto Fear and Greed Index highlighted the same, with the index noting a reading of 42 for the day. While this reading was slightly stronger than the previous day’s 40, it still denoted a fearful market.
Bitcoin SV [BSV]

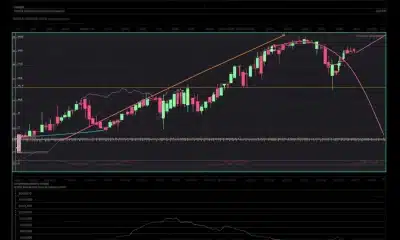
Source: BSV/USDT on TradingView
BSV formed an ascending triangle (purple) and broke out of its formation to test the resistance at $179. During that move, a rising wedge (white) was also spotted, one that showed that BSV was likely to descend back to $160. Bitcoin SV dropped sharply soon after as the price climbed to the target projected from the pattern.
At press time, BSV was trading at $159 and was seeking to bounce off the support at $157. It remained to be seen if the bears can drive the price beneath the support level, or if bulls had the wherewithal to test the resistance once more. If the trade volume continued to remain flat, it might favor the bears.
Polkadot [DOT]

Source: DOT/USDT on TradingView
Polkadot was unable to break out to the upside of the trendline resistance (orange) as it registered successive lower highs. The support at $3.88 can be expected to weaken following each assault by the market’s bears.
While a break out to the upside is possible, a break beneath the descending triangle being formed was very much likely.
It would be a priority for the bulls to defend the region at $3.9. However, the odds could be stacked against them as the Directional Movement Index pointed to a strengthening bearish trend as the ADX (yellow) climbed above 20.
FTX Token [FTT]

Source: FTT/USDT on TradingView
The RSI told the story of FTT for the past month. The downtrend persisted throughout September, with a week-long surge that saw $4.15 tested twice, but to no avail.
The RSI was observed to have chopped about the neutral 50-zone last week as FTT lacked the momentum to move in either direction. In fact, the market’s sellers won the tussle recently and were able to push the price to $3.38. At press time, the price stood at $3.55.
This move was likely a retest of the region of supply before sellers occupied the driving seat once more, with the next level of support at $3.28.