
Since 10 December, Bitcoin had been struggling to make gains, mostly moving between $7100 and $7500 and dipping as low as $6400 in the middle. Bitcoiners rejoiced today after the original cryptocurrency managed to break above the $7500 mark, possibly signaling a movement to greener pastures.
Bitcoin 1-day chart
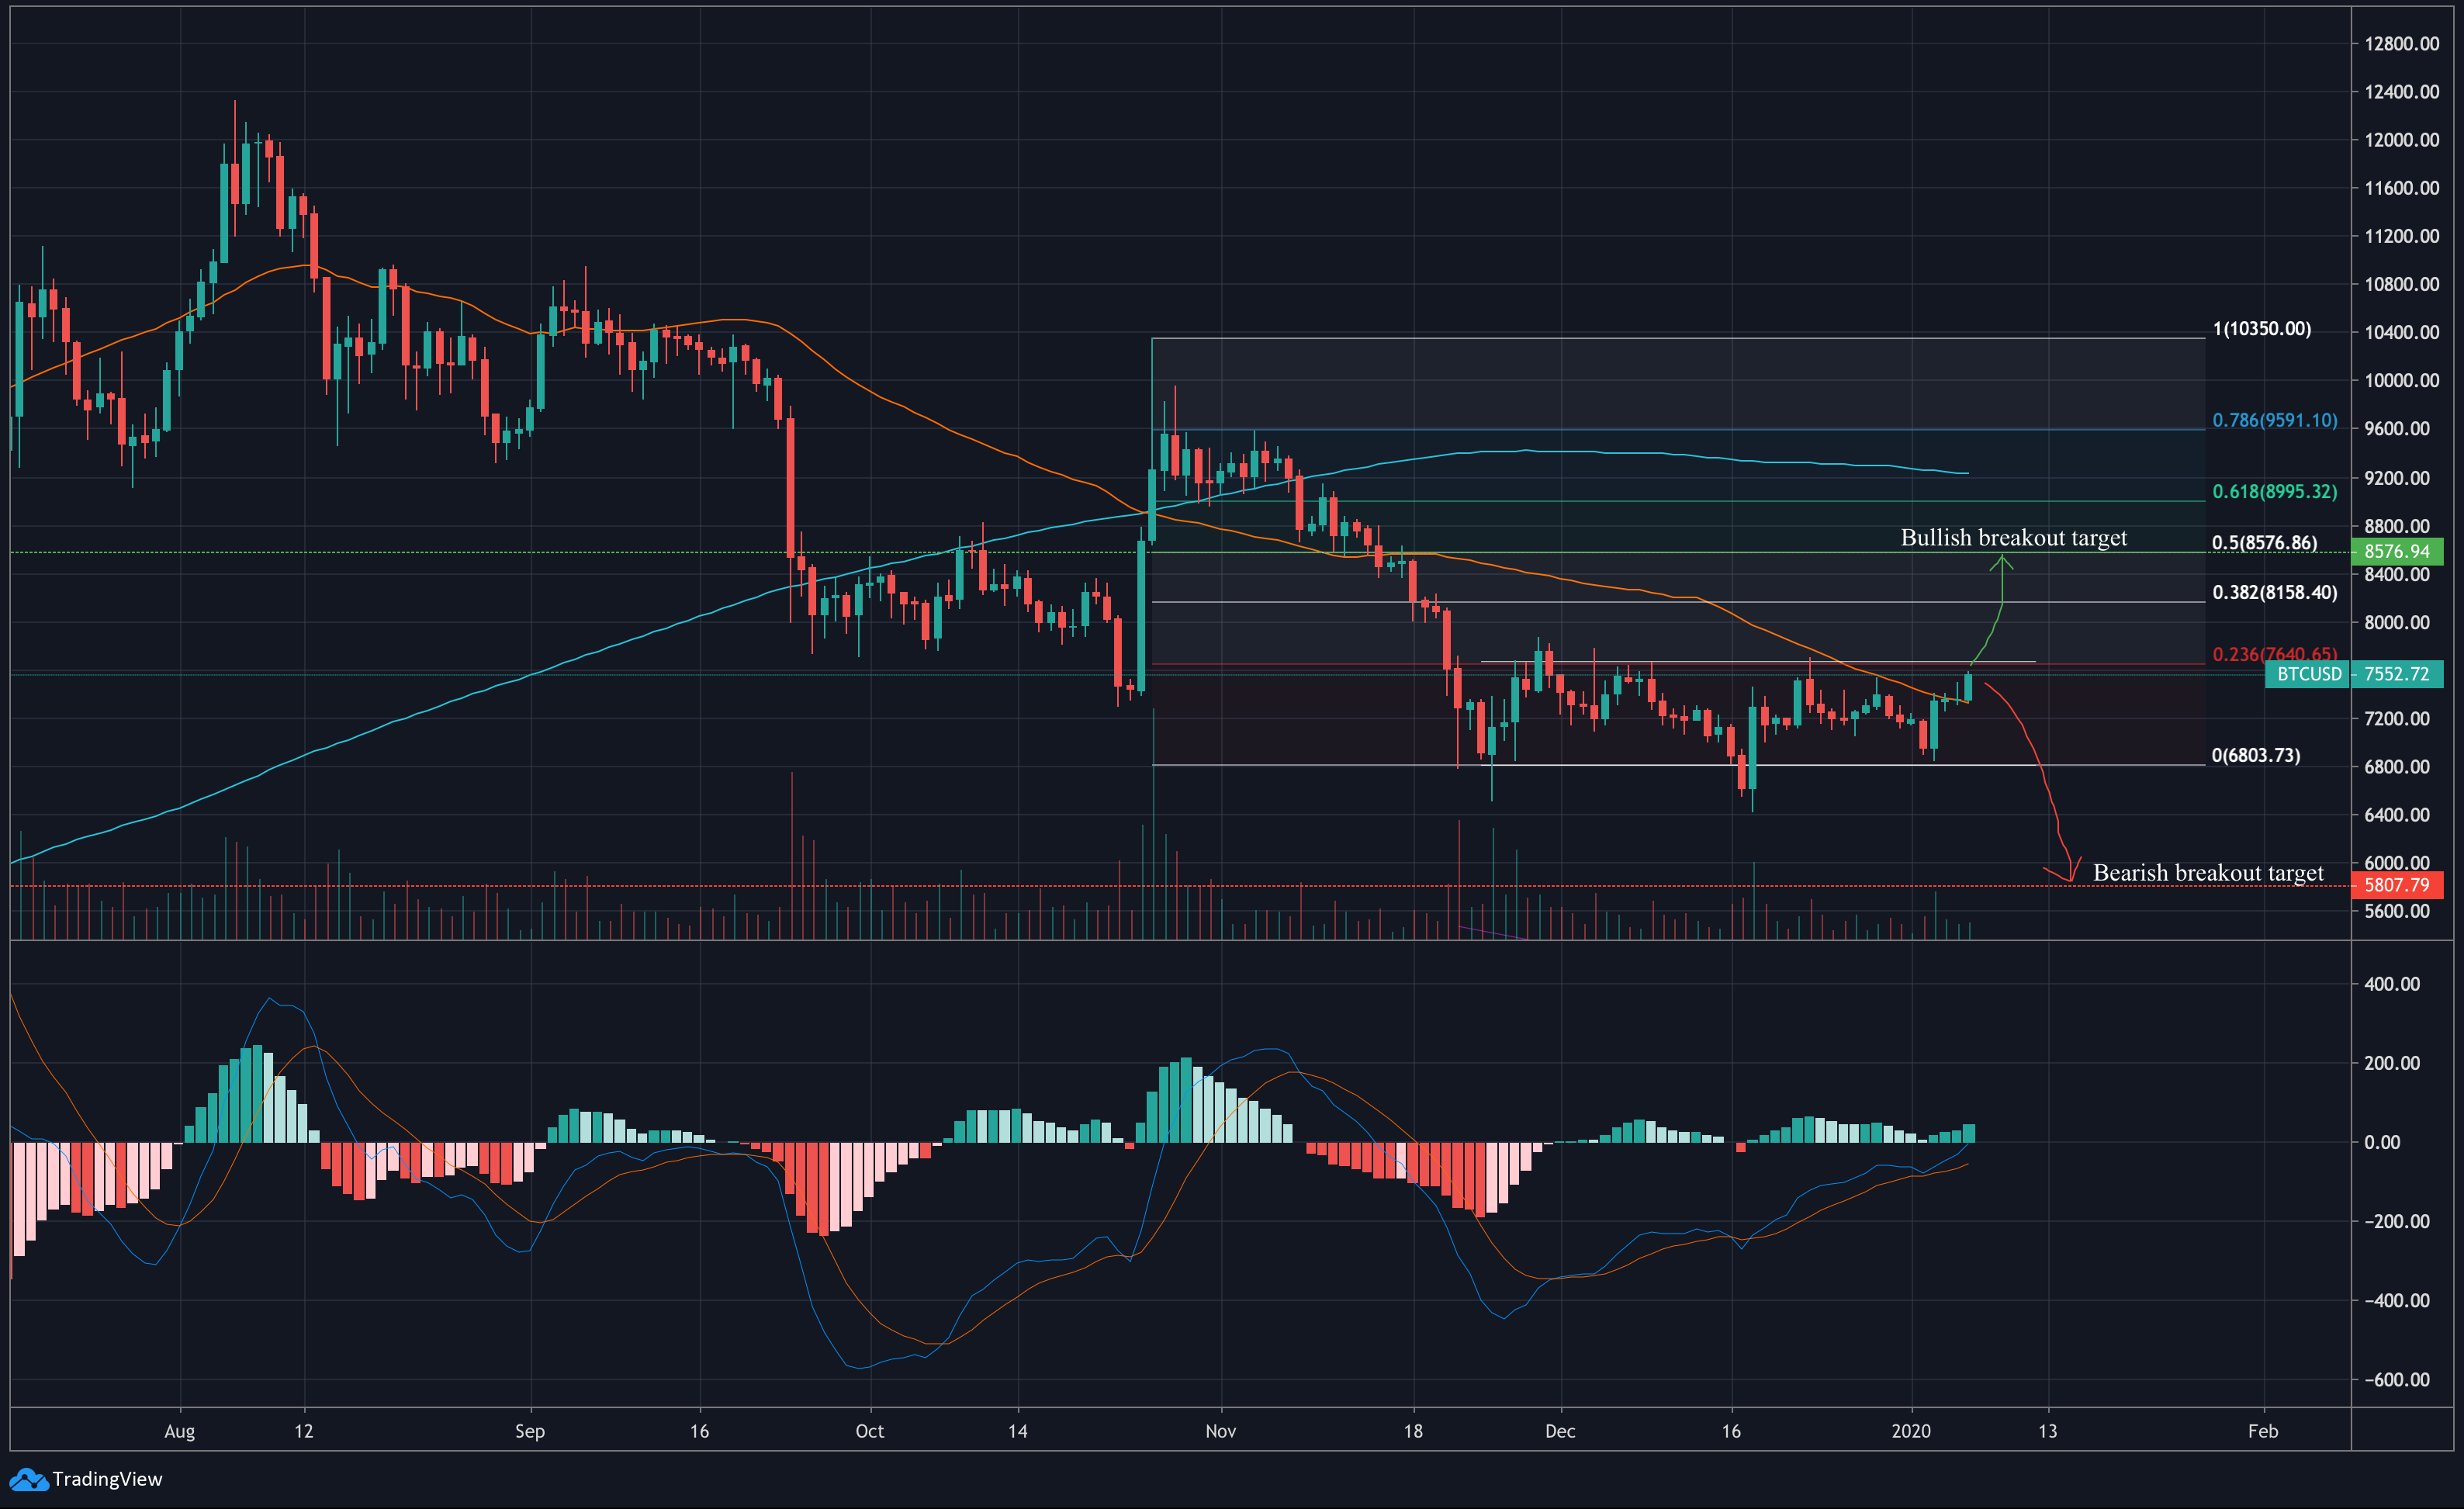
Source: BTC/USD on TradingView
The daily chart for BTC showed the latest candle testing the 23.6% Fibonacci retracement line at the $7552 mark, at the time of writing. Bitcoin seemed to have entered a rectangle bottom pattern in late-November, accompanied by a decreasing trend in volume.
The trade volume indicator at the bottom of the candlestick chart showed that as the price approached the pattern boundaries, volumes decreased, followed by a spike in volume as the coin attempted to break-out from the pattern. With volumes decreasing at the end of the price line, we could see a spike, causing Bitcoin to break above the rectangle bottom.
The 50-day moving average was seen moving just under the latest price candle, a traditionally bullish signal for an asset’s long-term. Also, this is the first time BTC has risen above the 50-day MA since mid-November. On 25 October, a death cross scenario occurred, wherein the 200-day moving average crossed above the 50-day MA. This is a typically bearish situation and it is still in play to this date.
The MACD, however, was indicating short-term bullish movement as the blue MACD line maintained its position above the signal line, with both floating just under the 0 mark.
Bitcoin On Balance Volume
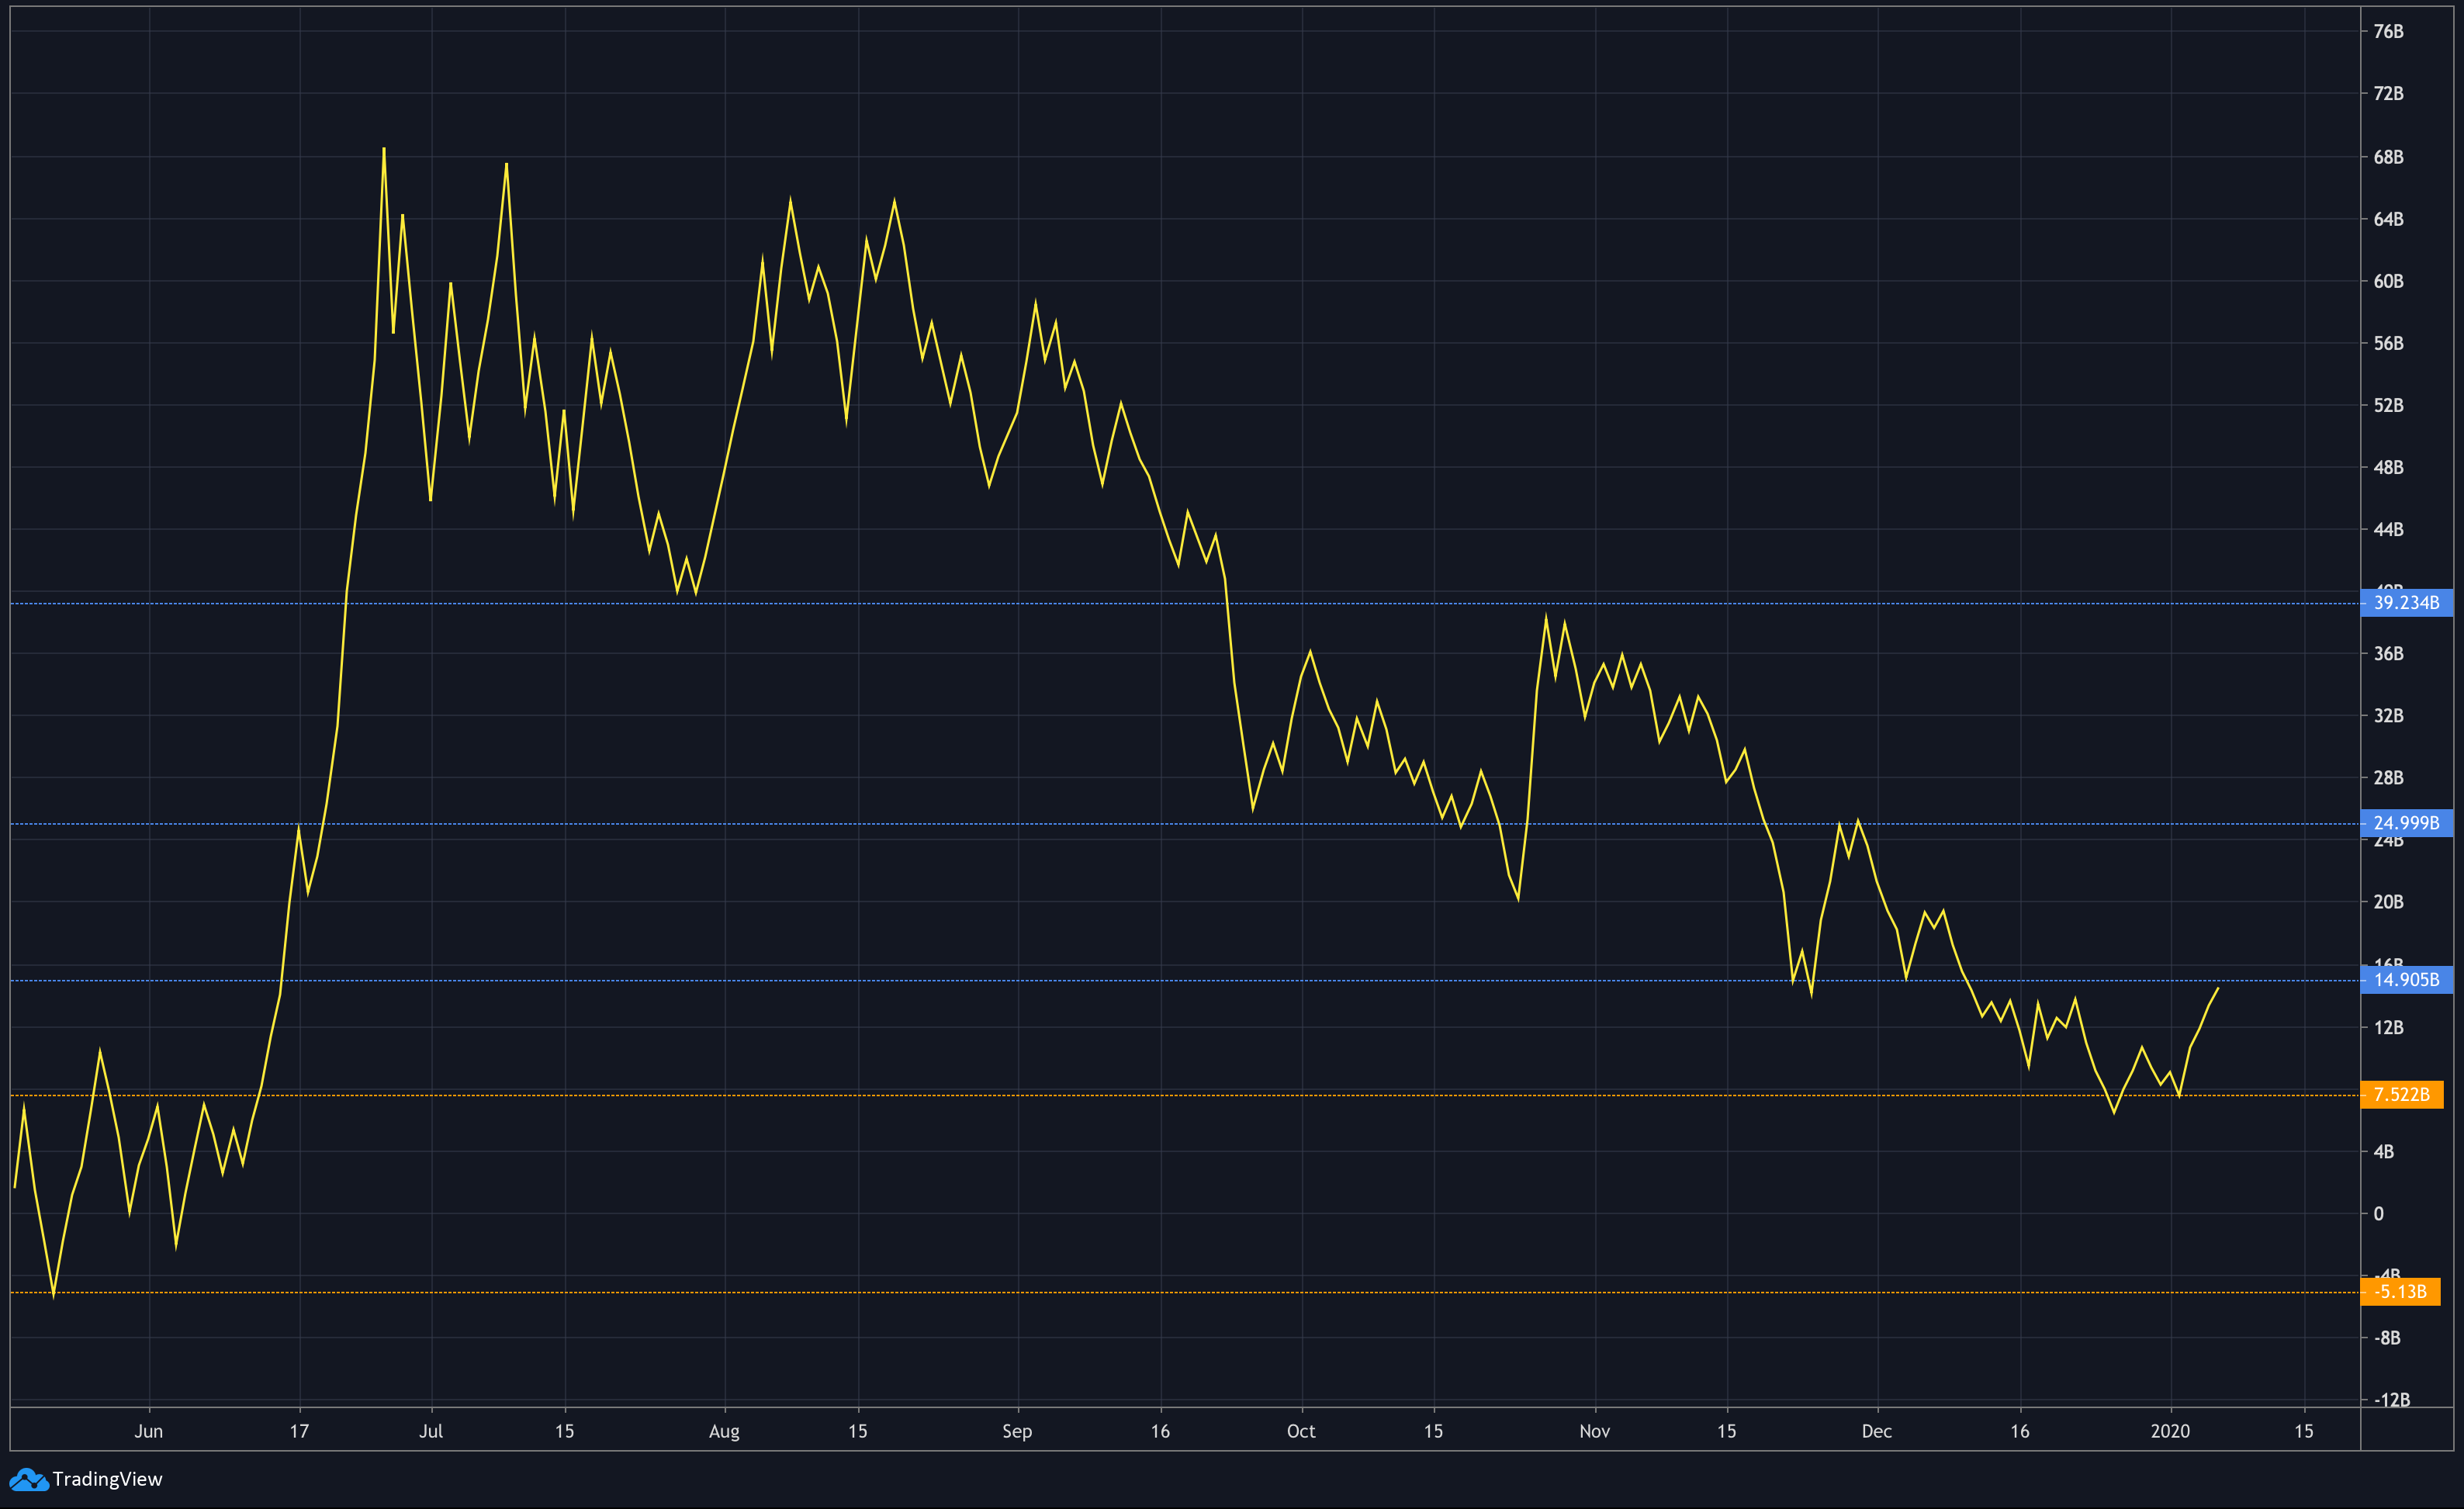
Source: BTC/USD on TradingView
The ‘On Balance Volume’ indicator is a cumulative metric of trade volume over the period. More buy-volume raises its value and more sell-volume makes the metric go down, and the direction of the indicator can be used to predict price action.
The above chart shows Bitcoin OBV about to test the resistance at the 14.9B mark. With buy-volumes on the rise since 2 January, we could see an increase in BTC’s price in the near future as cumulative volumes continue to increase.
Volatility
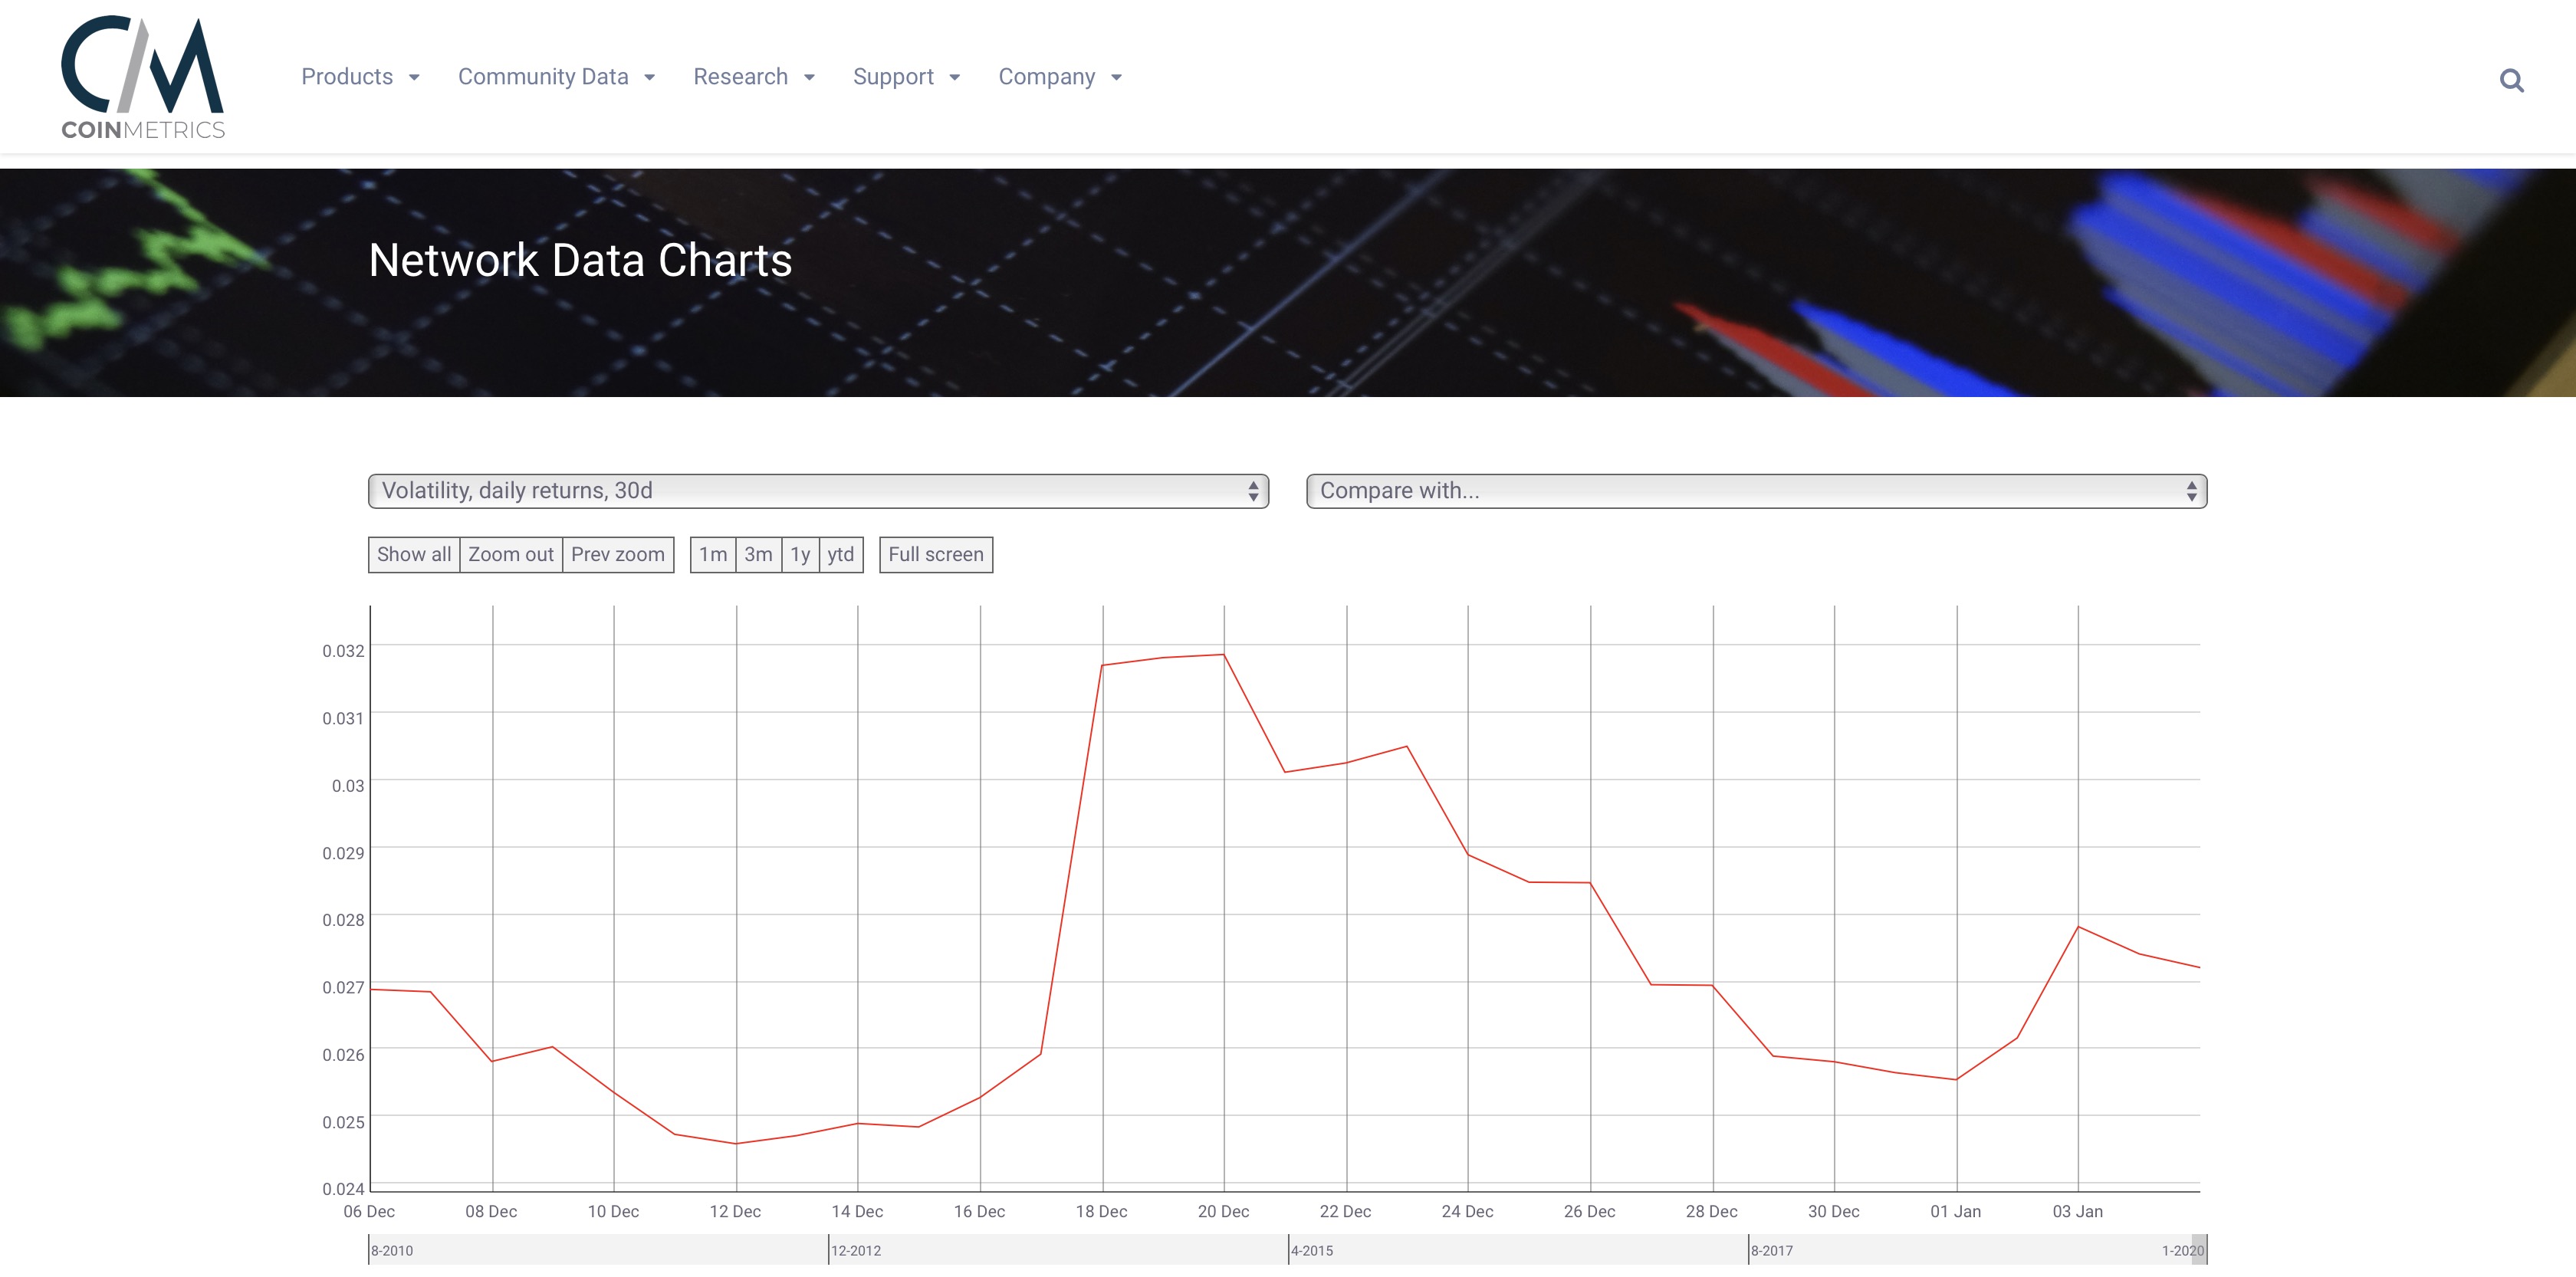
Source: CoinMetrics
CoinMetrics’ data showed that Bitcoin’s volatility (based on 30d returns) is higher now than it was at the beginning of the year, though it certainly has dropped since 18 December, a day when BTC’s price busted out of the symmetrical triangle. Though there has been a slight dip in volatility since 3 January, the relatively higher volatility could allow for larger price swings in the near future, though that includes downward breakouts.
Conclusion
Bitcoin is likely to break above the pattern boundary and could rise to almost $8500 in the coming week. Despite bullish signals from many indicators, if the price were to break downwards, BTC could drop colossally to $5800 over the same time frame.


