
On a macro scale, Bitcoin has been consolidating for over 2 months; however, a much lower timeframe of 1 to 4 hour indicates that Bitcoin broke bullish after more than 3 days of descent.
The price of Bitcoin tapped a higher $9,800 level and broke out of a falling wedge. The price rose by 5.41%, breached $10,000 and hit a high of 10,400, after which, the price started its descent and is yet to find a support level. The price is still bouncing between the larger pattern as it moves toward the tightening apex.
4 Hour
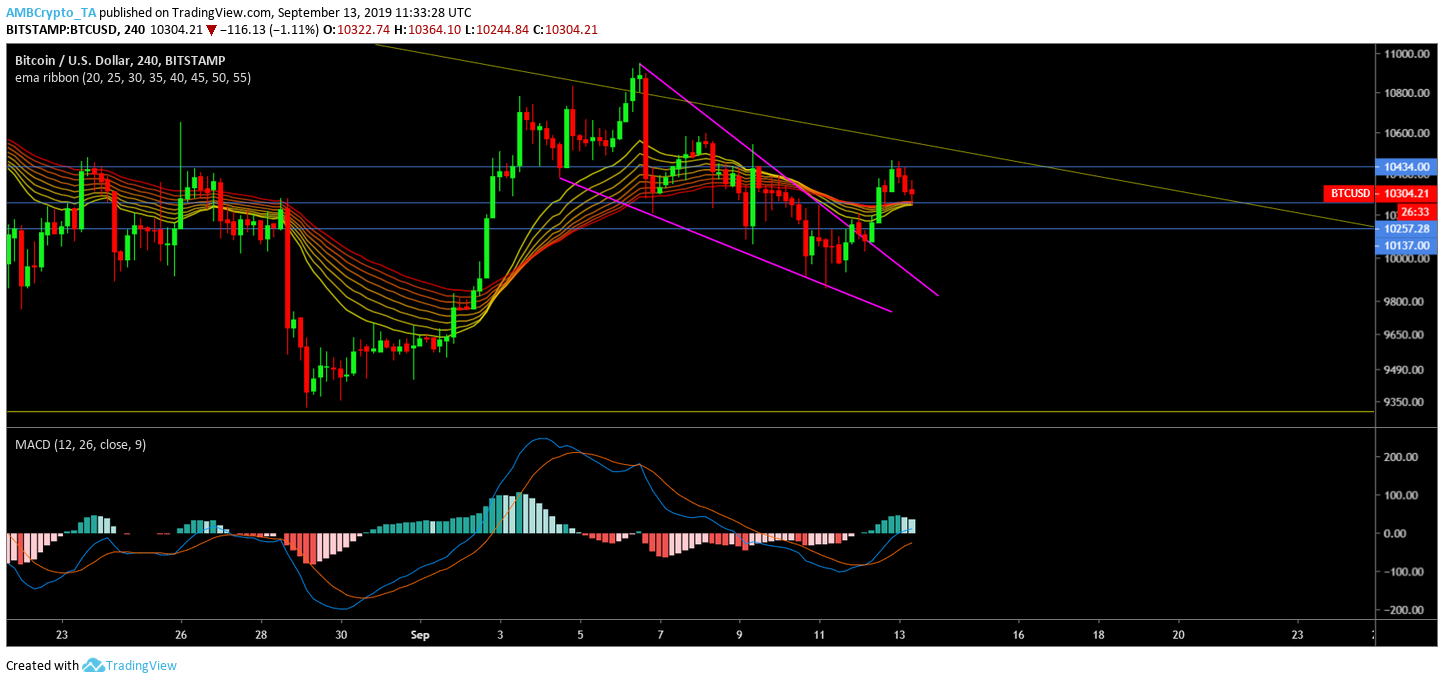
Source: TradingView
The 4-hour candle, at press time, is being supported by the EMA ribbon at $10,257. EMA lines are compressed with shorter EMAs trying to perform a bullish crossover over the bigger timeframe EMAs, indicating an impending bullish move. If the support does hold, the price might retest resistance at $10,434, on the contrary, if the support gets breached, BTC will head to $10,137.
MACD on this time frame is also looking bullish and has slowly started to get above the zero-line.
Bitcoin’s Uncertainty
The weekly timeframe shows two possible scenarios that are, in a way, eating away at traders, unable to decide which scenario might play out.
Walking around with conflicting ideas in the head is an uncomfortable position to be in.
Hence, we believe one as per our bias.$btc pic.twitter.com/xMVgJJ1yEB
— Mohit Sorout ? (@singhsoro) September 11, 2019
In a poll conducted by the above trader, almost 19% believed that it was a symmetrical triangle while 31% believed it was a descending triangle; remaining majority said they did not care about the breakout and that they would trade irrespective of the direction.
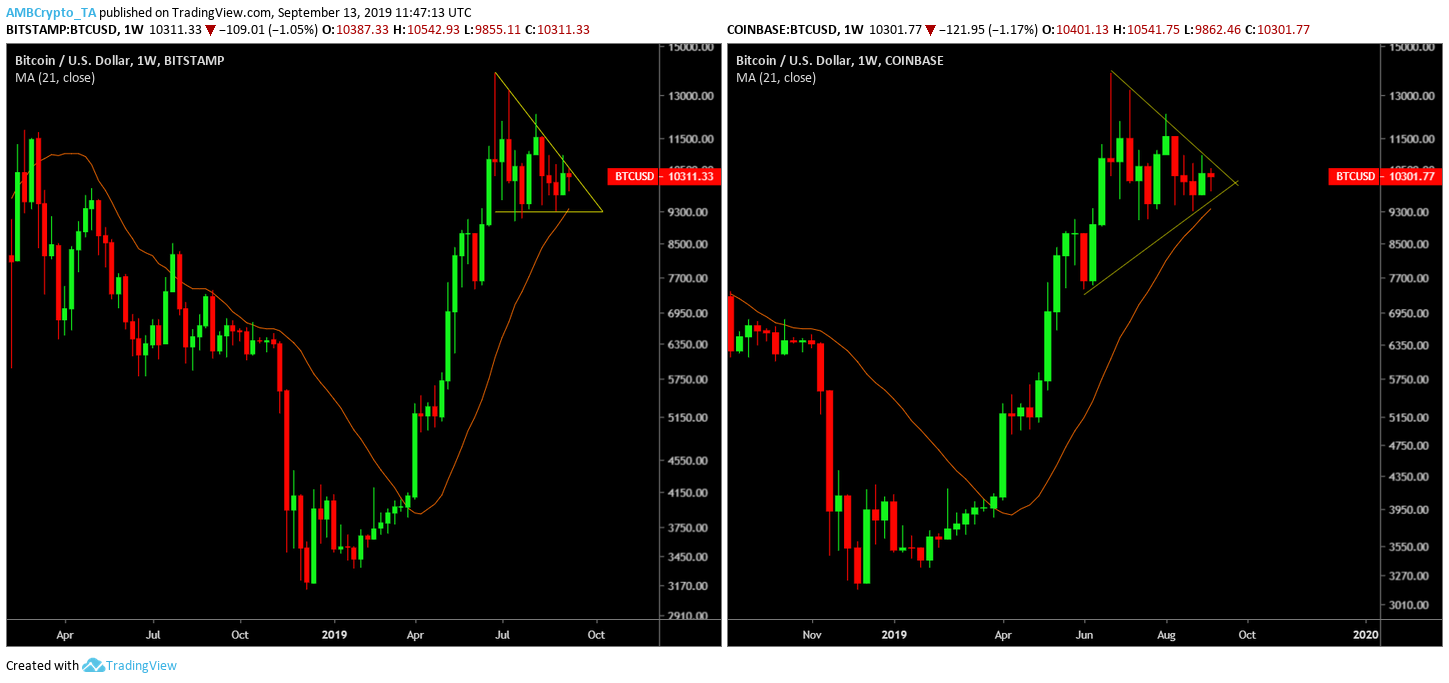
Source: TradingView
While the pattern is shrouded in mystery, one thing that can be observed is that the 21-weekly moving average heading closer to the price and is currently hovering around $9,380, which also happens to be support level that’s already been tested over 4 times. Will this level breach be breached during the breakout? There are chances that the price might dip below the 21 weekly moving average and head lower.
The 21 weekly moving average has a historic significance. Bitcoin was above this level for over 800 days and only broke below it after 2017 high. At press time, BTC moved above the 21 weekly moving by the end of March 2019 and has been above it ever since.
Targets
In the next 24 to 48 hours, price of BTC, if the support holds, will retest high of $10,434. If it doesn’t, there will be a retest of $10,137. The chances of both of these happening in succession are also possible.
Important levels – $10,137, $10,434, $10,700


