
Undoubtedly, 2020 will be a key year for Bitcoin in the macro-economic market. Competing with store-of-value assets like gold, oil, and market indices, as well as high market-cap stocks while vying for similar investors, the volatile nature of Bitcoin might be key going forward.
When YTD is considered, it can be seen that Bitcoin is up by over 30 percent. Over time, Bitcoin has seen its correlation with all three major SoVs – gold, the S&P500, and oil move in a confusing manner, more than anything else.
At the beginning of the year, Bitcoin and gold saw a high correlation as the two were bundled up as safe-haven hedges with tensions rising between the United States and Iran. Since mid-January, the correlation between the two has increased from 8.1 percent to almost 25 percent.
The equity-crypto movement has been less stable. Since reaching a 1-month correlation high of 24 percent, the value went down to -10.9 percent in early February as Bitcoin saw an isolated breakout over $10,000. Since then, there has been some parallel bullish movement, with the correlation at 9 percent.
Oil, on the other hand, is a peculiar case. Volatile as a standalone asset, even in comparison to Bitcoin, the WTI showed massive skews. On 8 January, the 1-month realized or historic volatility of Oil jumped over Bitcoin, with the former’s volatility at 119 percent, while Bitcoin’s was a lowly 54 percent.
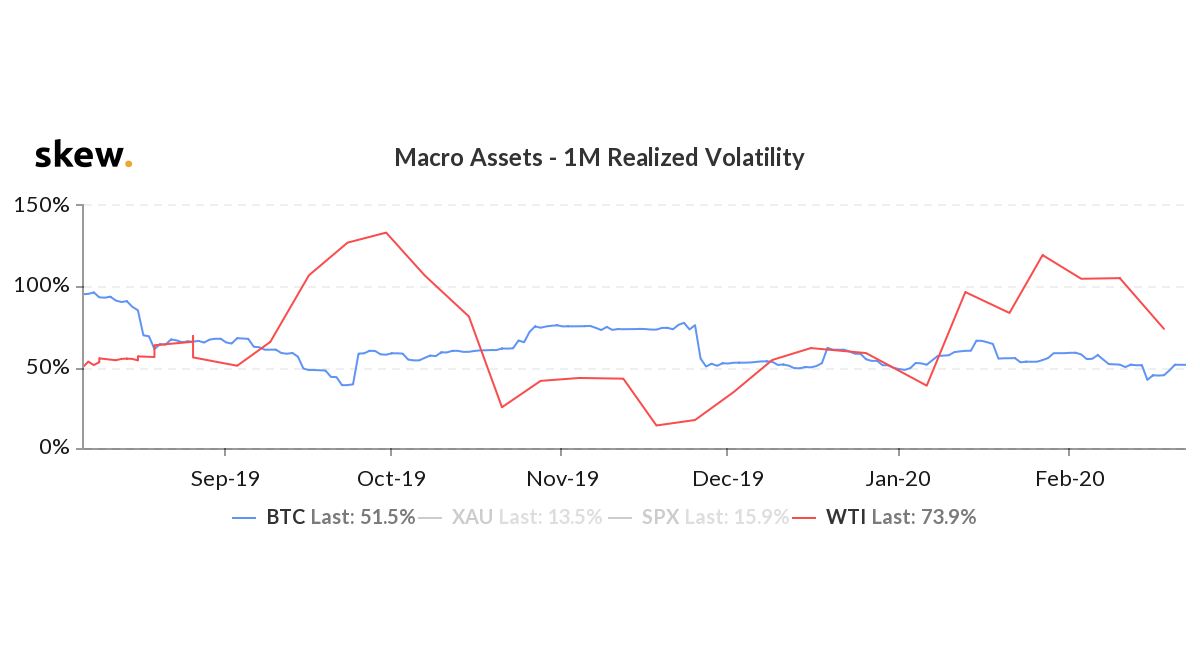
Source: Bitcoin vs WTI, 1-month realized volatility, skew
However, since topping out, the volatility of the two assets is looking to converge. Since the close of January, the volatility of WTI has dropped by over 37 percent, while Bitcoin has seen relatively stable movement, with its spot price locked in between the $9,600 – $9,800 range for the past two days.
The 1-year realized volatility also shows a similar tale. While the volatility of Bitcoin on the 1-year realized method is significantly over oil, recall that Bitcoin’s 2019 impetus only began in the second quarter of the year when its price jumped by over 17 percent on 2 April alone, triggering a move that would take it to $12,000 by the end of the quarter.
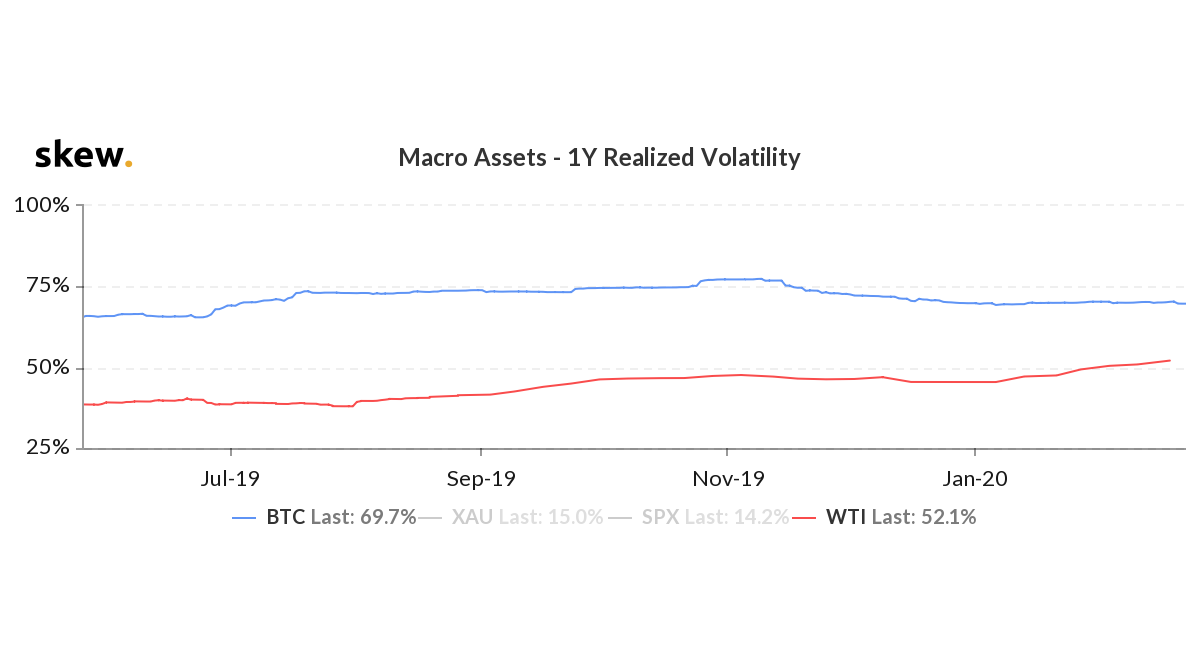
Source: Bitcoin vs WTI, 1-year realized volatility, skew
Since November 2019, the realized yearly volatility of the cryptocurrency has dropped by 9.7 percent. During this time, Oil’s volatility has picked up in similar terms, by 9.45 percent.
However, it should be noted that while the two assets are more volatile than the other assets in this class and both assets’ 1-month realized and 1-year realized volatilities are converging, the price swings are not.
While Bitcoin has added a third of its price since 1 January, oil has lost over 15 percent of its value.