XRP’s uncertainty could propel another downtrend

XRP’s price has been stuck below the $0.22 level for a long time. The third-largest cryptocurrency could be trouble as technicals indicate a potential retracement in the short-term.
XRP 12-Hour Chart:

Source: XRP/USD on TradingView
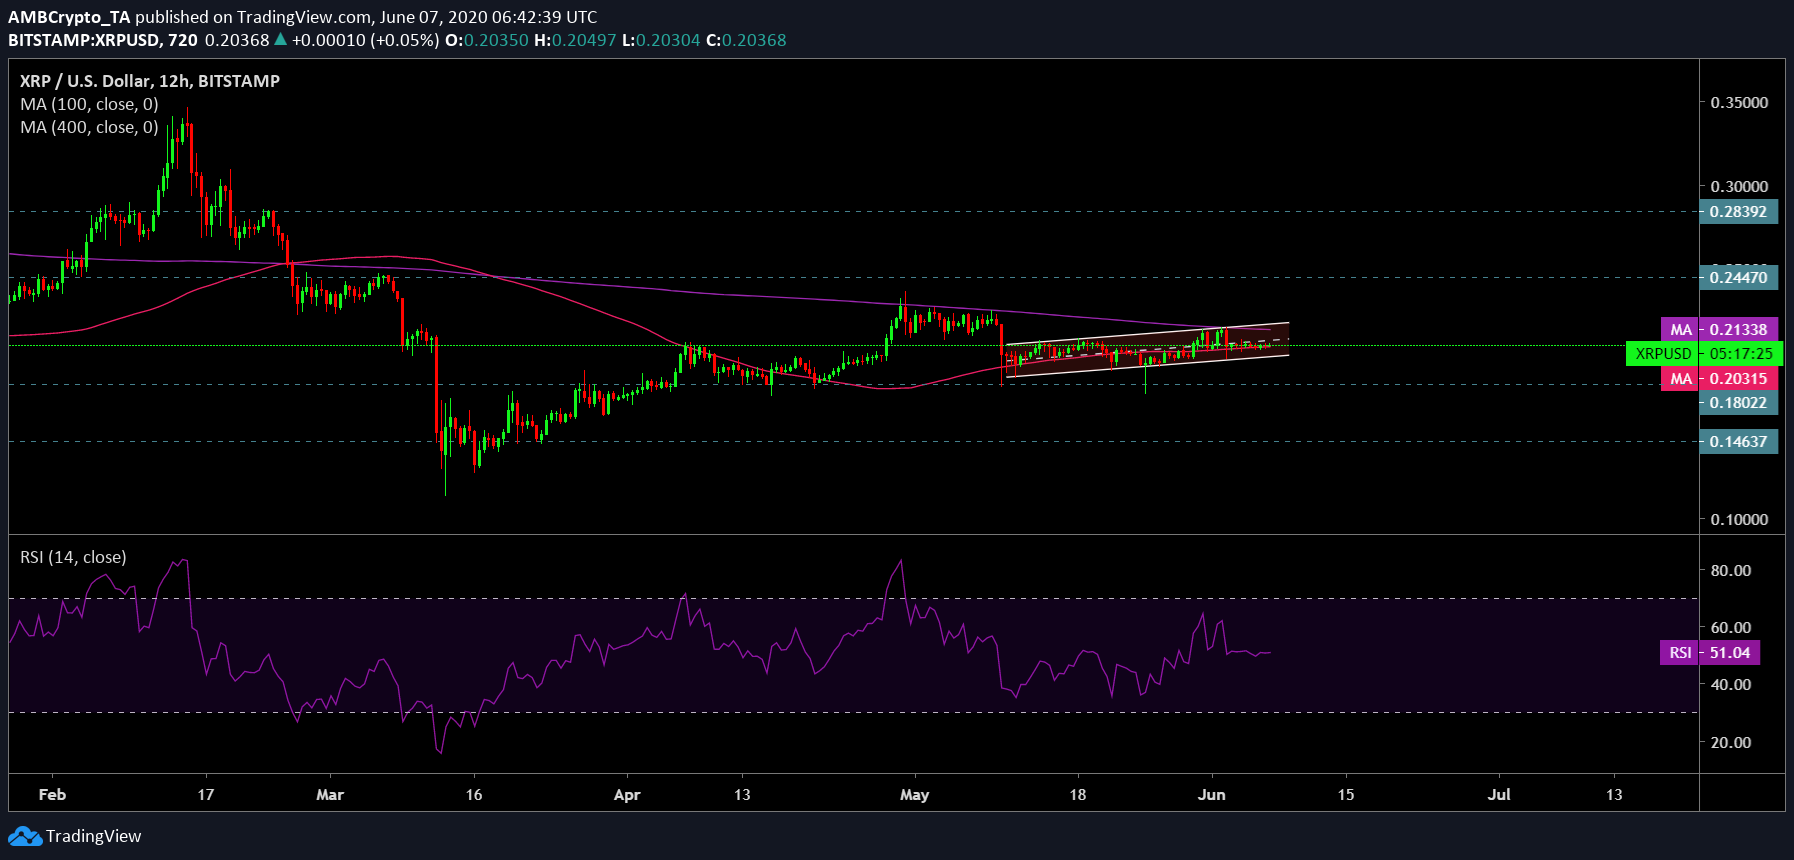
The 12-hour chart depicted XRP trading between the lines of an ascending parallel channel since the second week of May. A breakout from this pattern could potentially be a bearish one. The daily moving averages also aligned with a downside trend for the coin despite the price trading close to moving averages.
50 DMA [Pink] and 200 DMA [Purple] appeared to be approaching a golden cross. This, however, stagnated as both moving averages stand muted in the current levels and were floating parallel to each other, meaning the prospect of a bullish revival will have to wait.
In addition, 200 DMA continued to resist an upward movement of the XRP price candles. Also, RSI indicator appeared to be struggling near the neutral zone depicting a sentiment of uncertainty among the investors in the XRP market.
A flip towards the bullish side was highly unlikely as the price was severely resisted at points $0.244 and $0.283.
Bears have the upper hand
Despite the fact that the XRP bulls have aggressively defended the support zone, if the bearish breakout materializes, however, the coin could potentially retest $0.180, a level last seen on 15th April. If the XRP/USD pair slips below this point, it could fall to $0.146 level.
Correlation:
Bitcoin’s price actions have been closely mimicked by the altcoins and XRP is no different. Currently, BTC-XRP correlation coefficient stood at 0.818. At such a high correlation, Bitcoin could indeed help trigger a much-needed reversal for the coin.
Conclusion:
Numerous attempts later, the bulls have so far failed to achieve a strong upside momentum. As depicted by the ascending parallel channel, the moving averages as well as the RSI indicator, there is uncertainty among the market participants and this could propel another downtrend to follow. If the coin fails to pick up the pace, it could retrace its steps back to levels $0.180, and $0.146 as its resistance targets remained untouched at $0.244 and $0.283.


