A rather positive price movement was observed for XRP over the past couple of days. With XRP dropping down to $0.23 alerting the space, the recovery following the decline has picked up a lot of traction from the community. While many expected this rise to be the early signs of recovery, analysis suggested key levels that needs to attain before any clear suggestions can be made. However, on the short-term, the momentum was still bullish.
XRP 1-hour chart
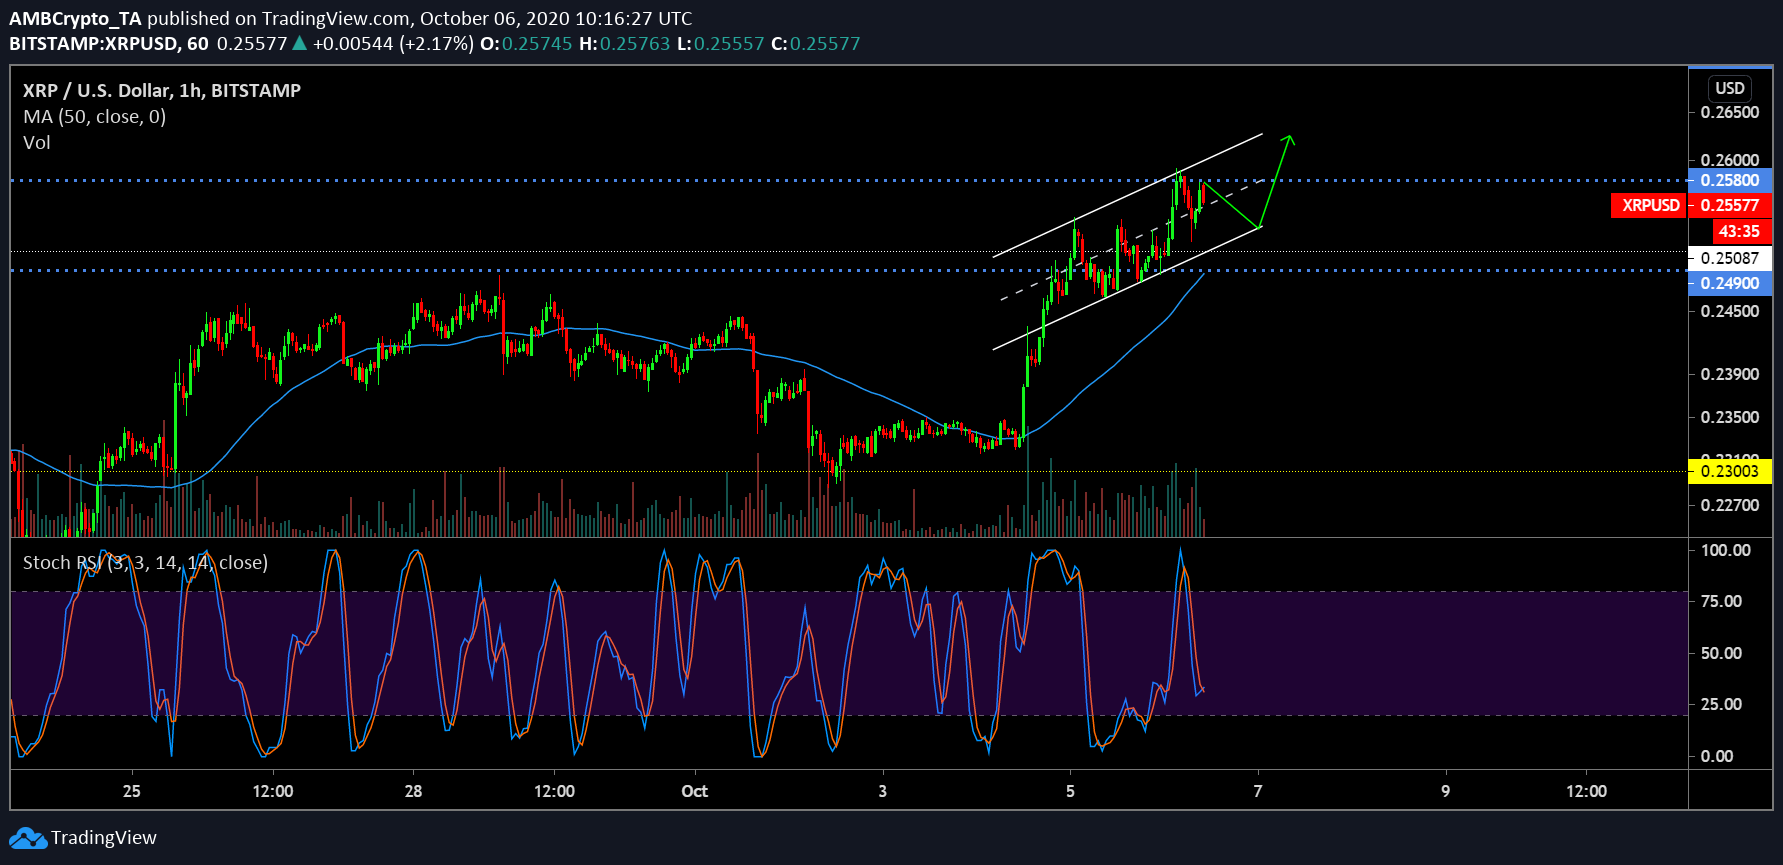
Source: XRP/USD on Trading View
For XRP, a de-constructed ascending channel can be observed but it might not carry the same bearish implications considering the price movement hasn’t defined proper higher lows and higher highs yet. The price movement between $0.249 and $0.258 has been a key range in the past during a transition period as evident in the chart over the past couple of months.
The main bullish factor associated with the above analysis is the strong volumes attached to the trading price. While a rising price should generally be attested with strong volumes, this particular pattern indicated promise from a price stability point of view.
Lastly, Stochstic RSI suggested a bullish crossover near the over-sold position, further solidifying the chances of another strong re-test at $0.260 and eventually breaching past the resistance at $0.258.
XRP 6-hour chart
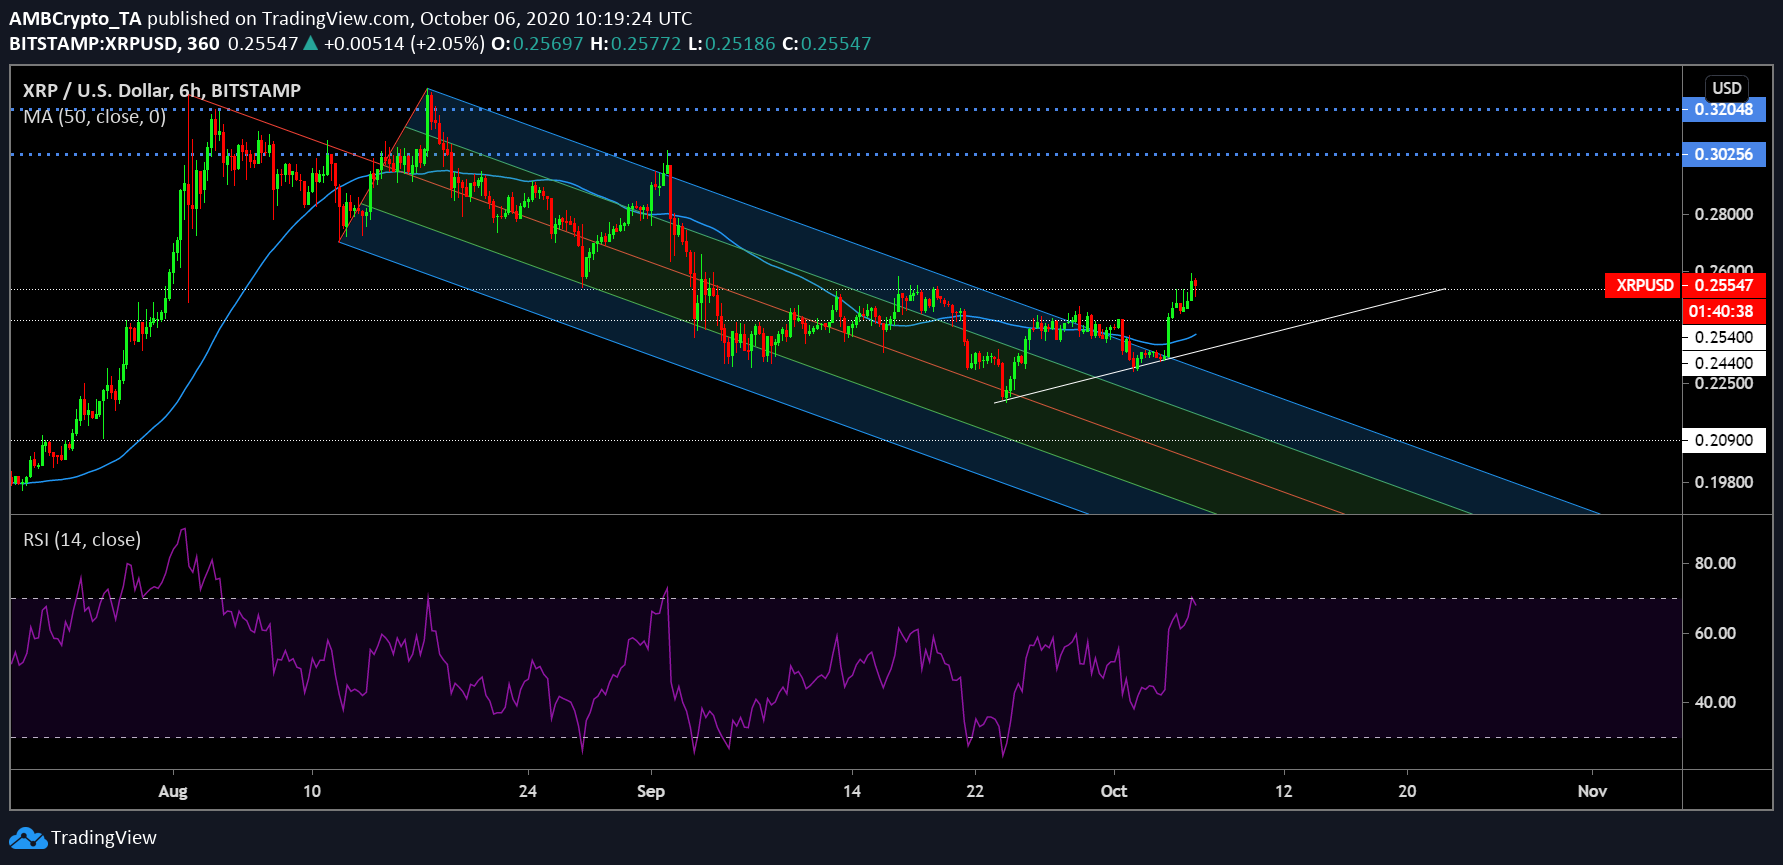
Source: XRP/USD on Trading View
As indicated by the Andrew’s pitchfork levels, XRP has finally breached away from the pattern at the bullish side of the levels. While a certain level of pullback should be expected, these are strong signs going away in the 4th quarter of 2020.
Now, with the valuation, for XRP it is of critical importance to attain a price position above $0.254 for the rally to remain bullish over the coming weeks. While it is easier said than done, RSI definitely suggested a bearish period with the indicator approaching a reversal on the over-bought position.
While a re-test at $0.244 can be likely, there are high chances of remaining clear of the support and attain new short-term highs.