XRP long-term Price Analysis: 20 October

The mid-term trend for XRP ended on a disappointing note as the valuation was unable to consolidate above the resistance at $0.254. With the price facing a little depreciation over the past week, the asset is currently sustaining a position above the support at $0.244. At press time, XRP had a market cap of $11.09 billion with a trading volume of $1.52 billion.
XRP 4-hour chart

Source: XRP/USD on Trading View
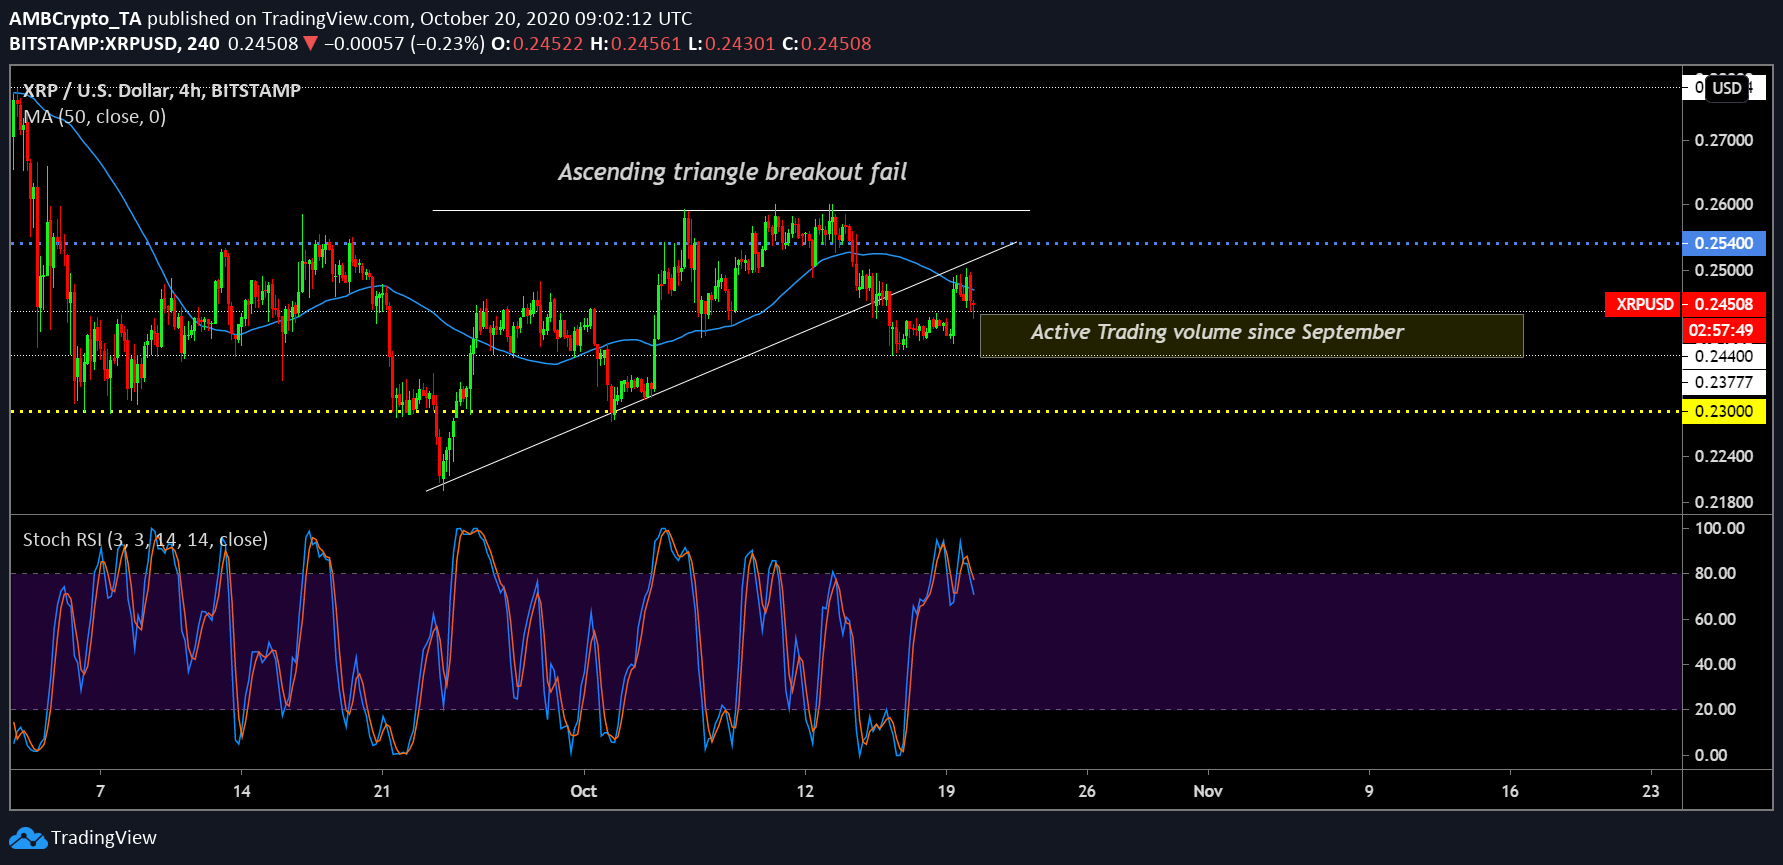
A deceiving pattern on the 4-hour chart would have hurt XRP’s proponents, as the price nose-dived from an ascending triangle. The valuation seemed destined for a bullish break above after the token tested the upper parallel trendline. However, the asset failed to consolidate above $0.254, leading to its current position.
Currently, XRP is near its support at $0.244, which is a little bit concerning as the 50-Moving Average moved above the candles. While signs of a transition are still prevalent as the price range between $0.244-0.237 has been an active range over the past few weeks.
The major bearish trait is observed on the Stochastic RSI which is clearly picturing a collapse after the bearish marker completed a crossover with the blue line, at an over-bought position.
XRP 1-day chart

Source: XRP/USD on Trading View
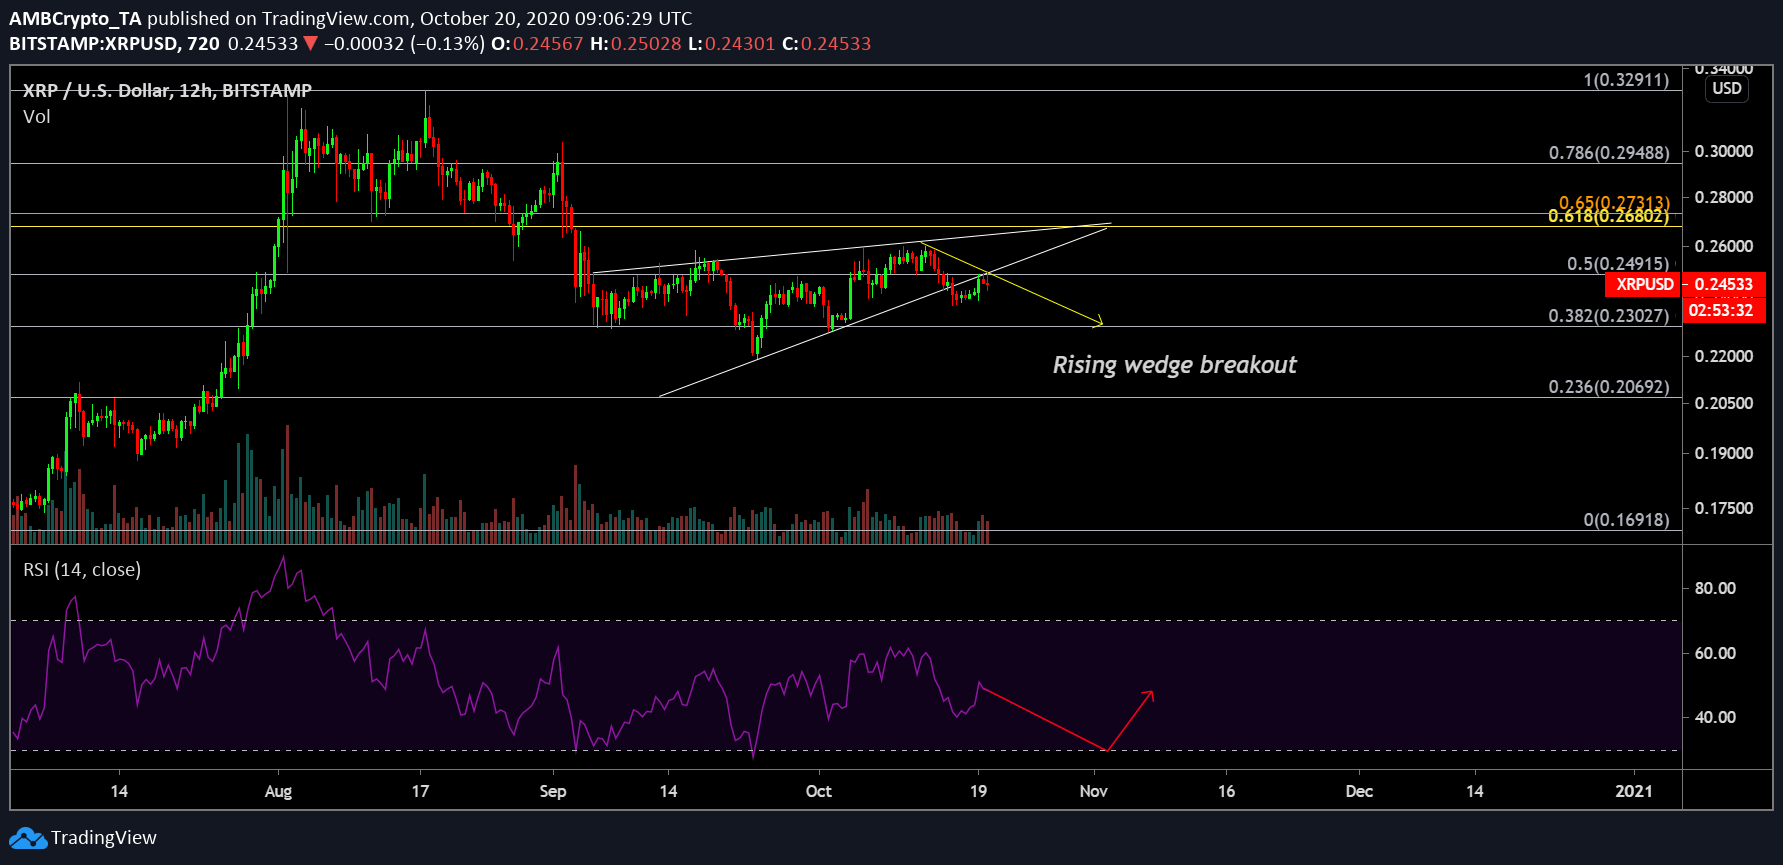
Now, on observing the 1-day chart, the asset might be heading for another period of correction. A breakout from the rising wedge pattern is a clear indication of the current trend i.e bearish. While the token might still attain a position above the resistance at $0.5 Fibonacci ($0.249) it is difficult to see it past $0.268 with the current market structure.
Relative Strength Index or RSI suggested a return of buying pressure but it can be stopped-short but the current bearish predicament. The indicator may attain a position at the oversold region before testing another rally upwards.


