XRP long-term Price Analysis: June 10th

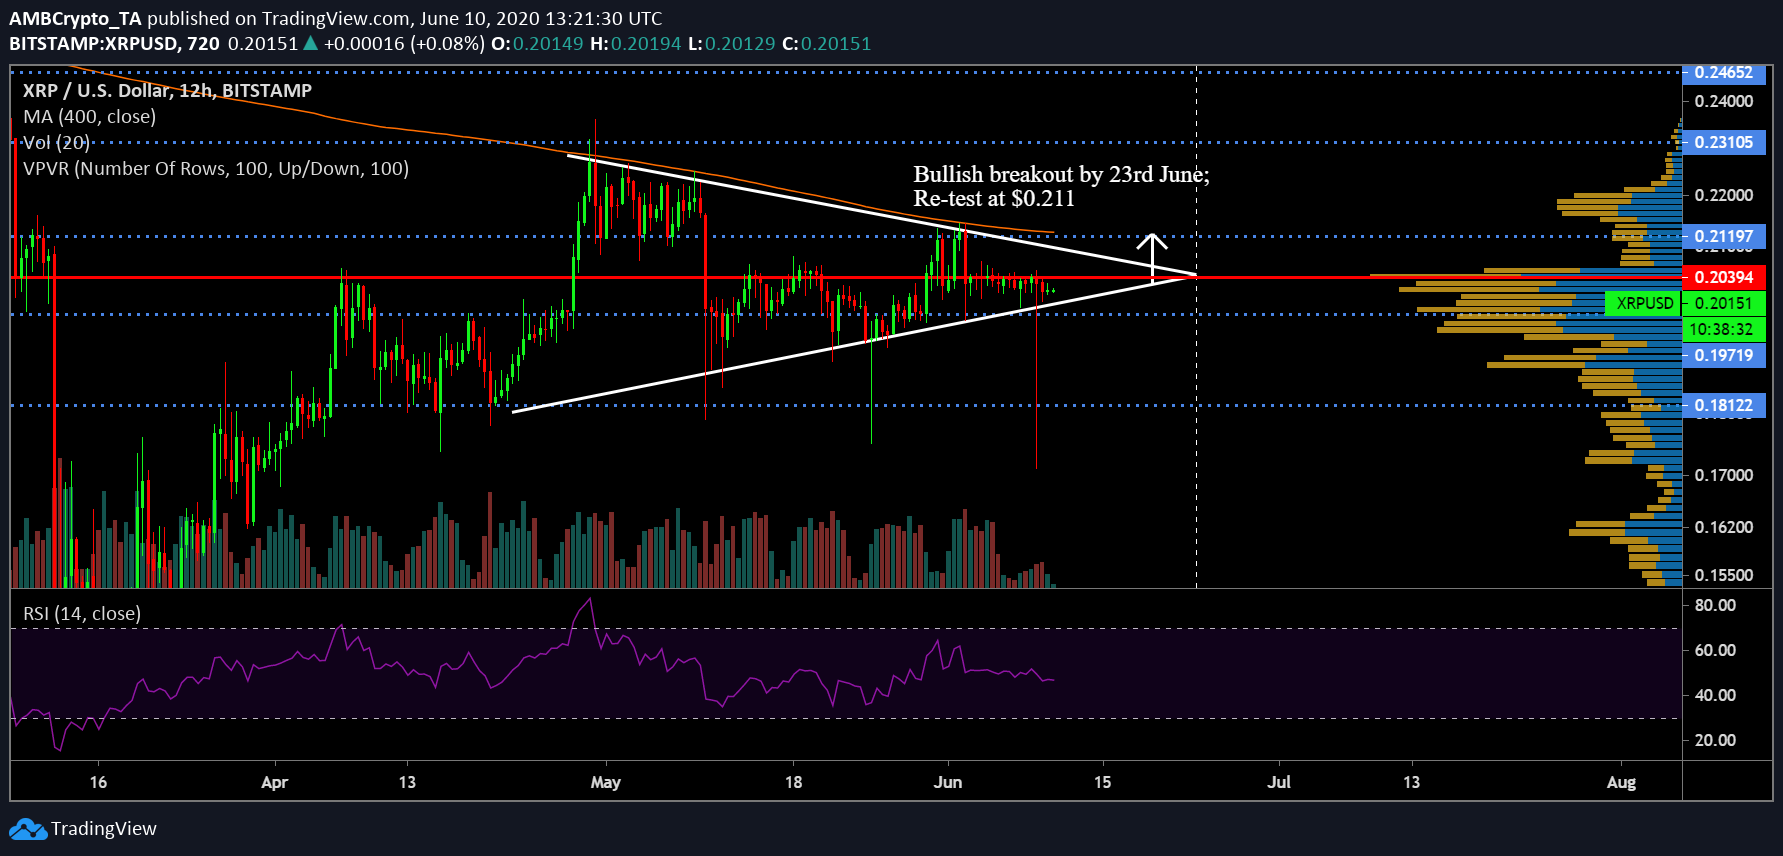
XRP has succumbed to a significant period of stagnancy over the past 7 days. From June 3rd to June 10th, the asset has undergone minimal movement between $0.205 and $0.201 but on 9th June, there was an unusual drop down to $0.171.
XRP 12-hour chart

XRP/USD on Trading View
After registering a high of $0.231 in the start of May, XRP’s valuation continued to oscillate between two trendlines which incline and decline respectively. The movement of the trendlines has given rise to a symmetrical triangle pattern which opens up the possibility for both a bullish or bearish breakout over the next couple of weeks.
i) Bullish Case
Considering that the momentum shifts towards buyers’ market over the next few days, a breakout should allow XRP to breach immediate resistance at $0.211. Solidification of a local bottom at $0.200 would form strong support.
However, VPVR exhibited the presence of very strong resistance at $0.203. RSI also failed to inject confidence as the indicator remained completely neutral between buying pressure and selling pressure at the time of writing. Additionally, for the first time in a long duration, XRP has exhibited depletion of trading volume which suggests that the current price point is largely temporary.
ii) Bearish breakout

XRP/USD on Trading View
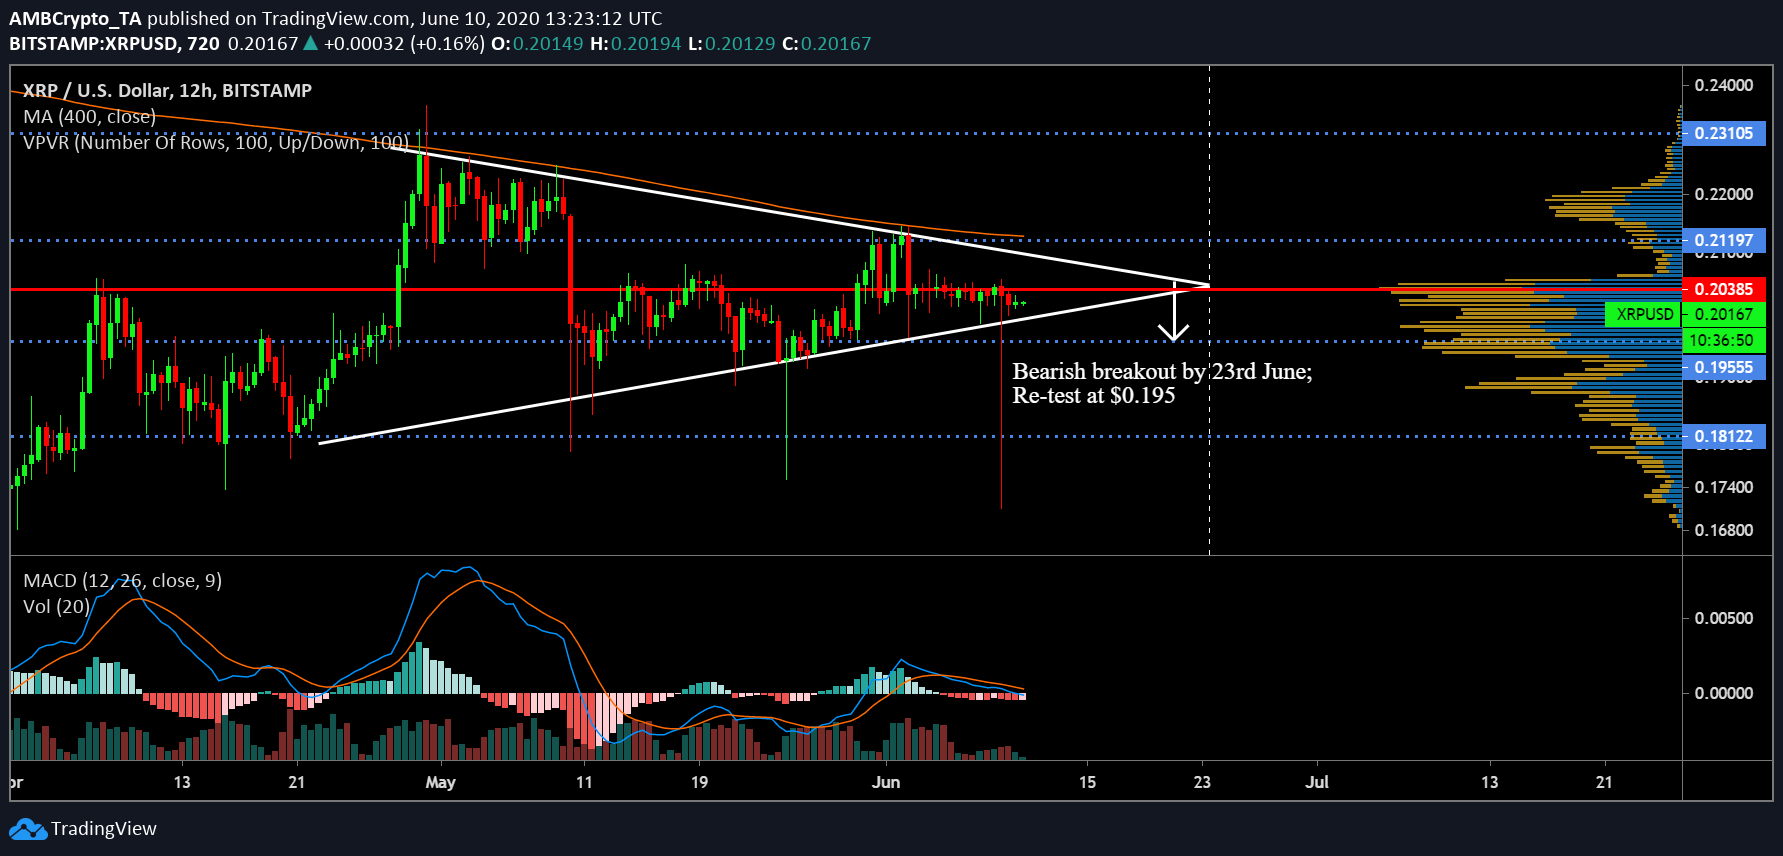
By the look of things, the argument for a downward slope gathers more steam. As observed in the chart, during the entirety of the symmetrical pattern, the asset has hovered under the Point-of-Control(red-line) for a majority of the period.
With strong resistance at $0.203, XRP is possibly eyeing another re-test at $0.195.
At press time, MACD also remained strongly bearish as the signal line hovered over the MACD line. Any position for XRP under $0.195 should prompt a quick bounce to support at $0.195.


