
Disclaimer: The following article attempts to analyze the emerging patterns in XRP’s long-term market and its impact on the price
Despite being the market’s third-largest cryptocurrency, the price of XRP has failed to sustain the growth it registered during its most recent market rally. XRP’s yearly peak was observed back in February, a time when it touched $0.3478. However, the price dropped soon after this peak. XRP, once again, surged to the level of its previous peak a few days back. Alas, it has been heading south on the charts since.
At press time, XRP was valued at $0.2727, with the cryptocurrency continuing to move lower down the price ladder.

Source: XRP/USD on TradingView
Unlike other major cryptocurrencies, XRP did not register a great surge in value, despite a rallying market. Its price has continued to remain under $0.3451 since July 2019. During the bull run of 2019, XRP’s price had briefly traded within the range of $0.3451 and $0.5062. However, in 2020, XRP has been unable to surpass its resistance of $0.3470.
XRP’s 4-hour chart was also highlighting a bearish picture. The 50-moving average has been hovering over the price candlesticks since 18 August. While the Bollinger Bands were diverging and signified a volatile market, the Signal line confirmed the bearishness as it remained above the price candles, underlining a change in the direction of the price movement.
Further, the Relative Strength Index recently bounced back from the overbought zone after XRP fell on the price charts. At the time of writing, however, the RSI was seeing both the buying and selling pressures evening each other out.
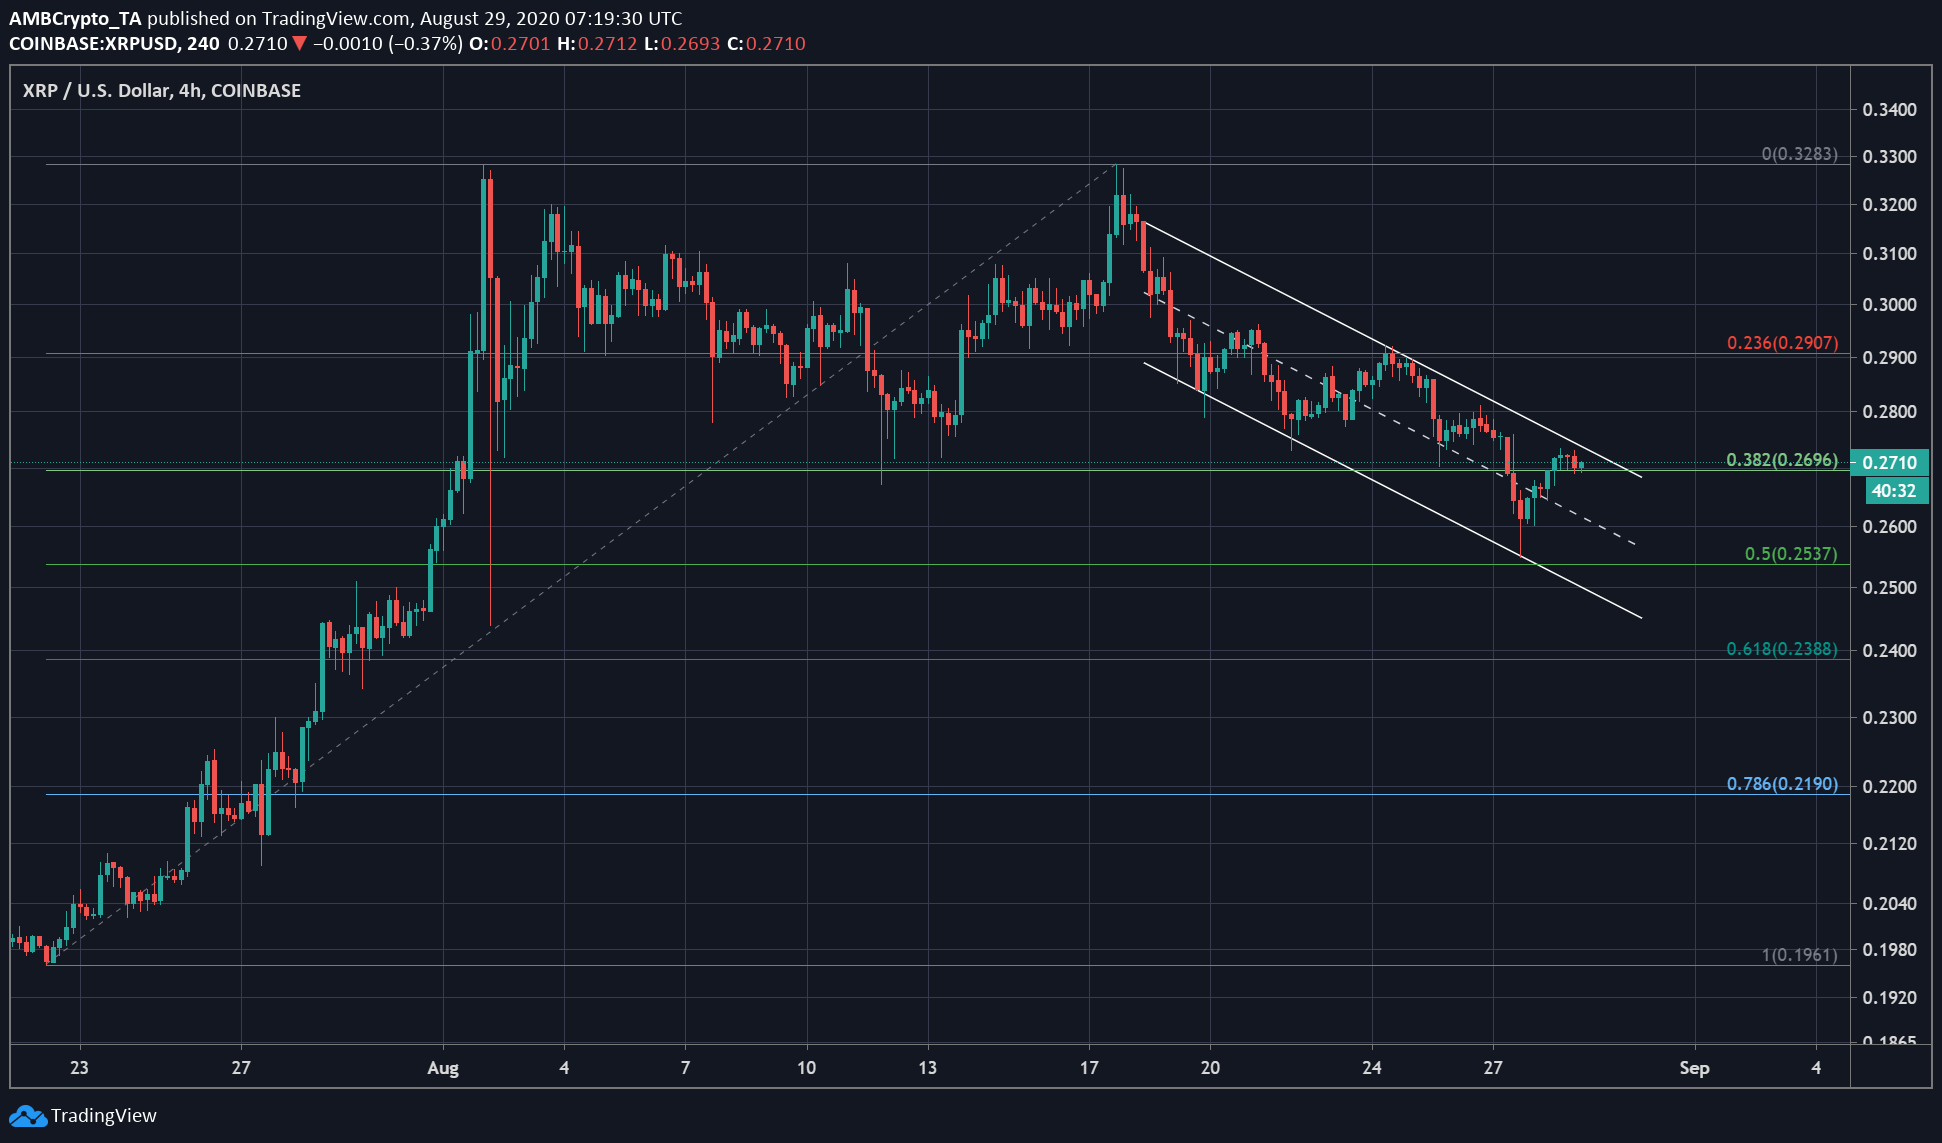
Source: XRP/USD on TradingView
As the coin was expected to drop further in the market, the Fib retracement offered the upcoming support points for XRP. At the time of writing, XRP’s value was close to the Fibonacci retracement level 38.2% at a price level of $0.2696. This level has been tested in the past, with the price also managing to bounce back from the same. If the coin does fail to return from this level, it may move lower down the charts to $0.2537.