
XRP fell 6.80 percent on 25 August. The collective altcoin market noted a depreciation of $12 billion which summed up the recent bearish episode of the August crypto cycle. As the month draws towards a conclusion, the valuation cycle seems to be coming full circle as some of the assets were potentially looking at 20-30 percent correction. XRP hasn’t been one of those assets yet but recent analysis suggested, it could be included in that list over the next few days.
XRP 1-day chart
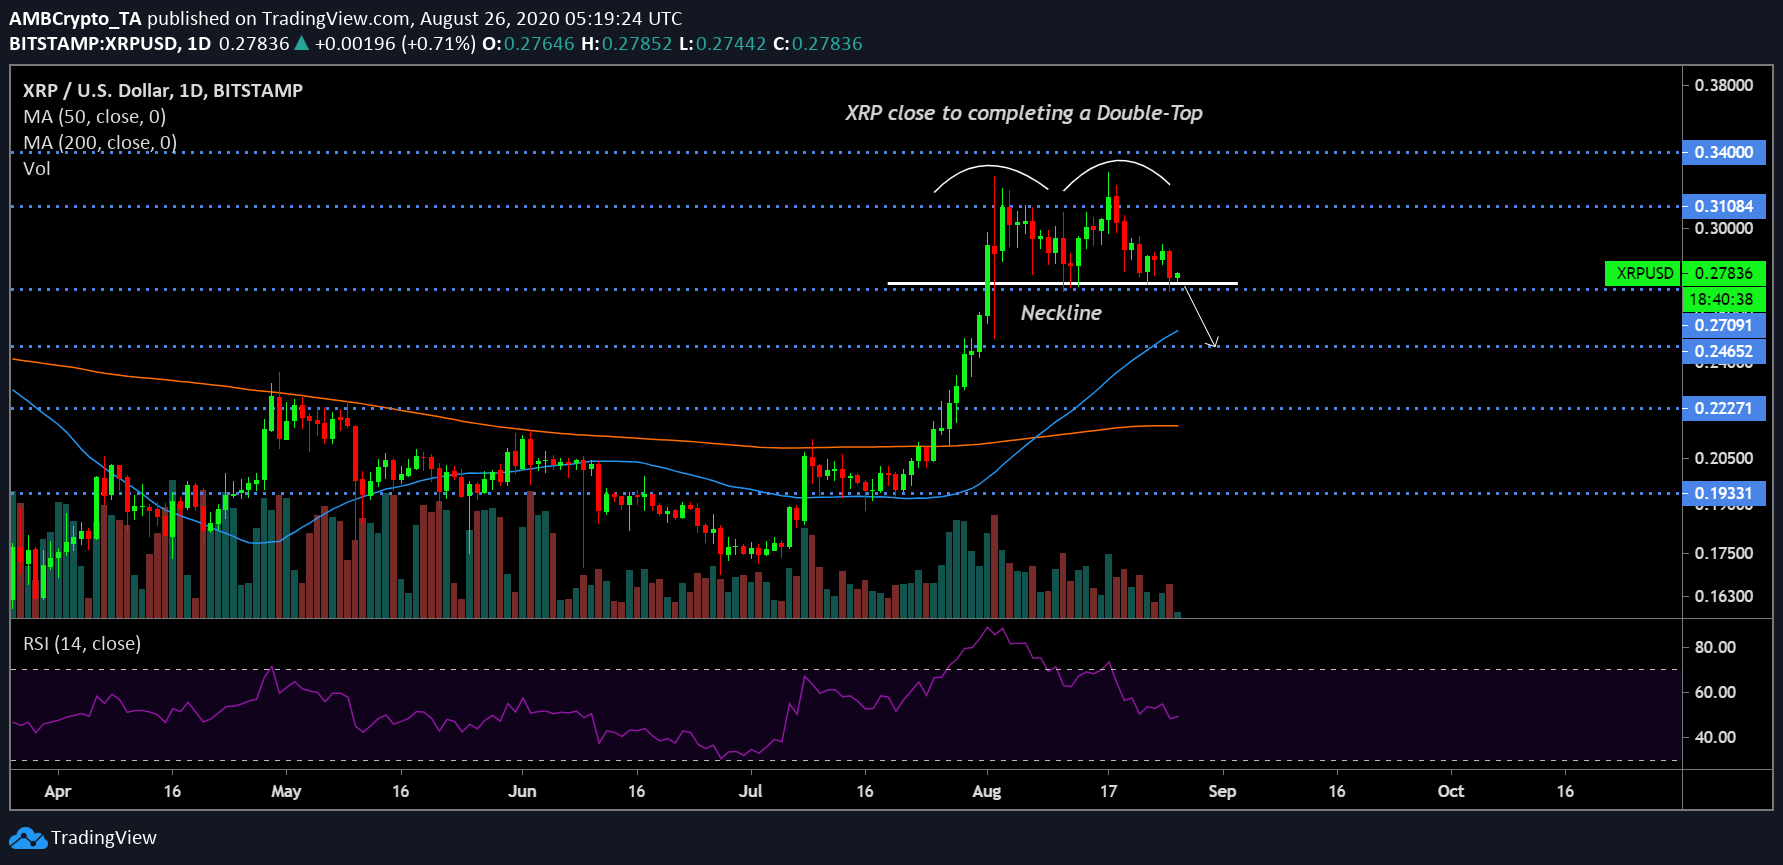
XRP/USD on Trading View
Since registering its high at $0.329 on 17 August, XRP shed 16.81 percent of its valuation, dropping down to $0.278 at press time. The 3rd largest asset is not alone as the collective trend was moving downwards as well. XRP is reaching a critical stage of completing a double-top pattern.
From the analysis illustrated in the chart, XRP re-tested the top at $0.329 twice during the 2nd and 3rd week of August, and now the valuation is at close proximity to the base neckline. For XRP, any drop below support at $0.270 will complete the double-top pattern, and XRP will possibly depreciate another 8-10 percent, declining to $0.246.
At the moment, XRP is trying to recover the past 24-hour-drop. With decreasing Relative Strength Index suggesting increasing selling pressure, the likelihood of the double-top pattern coming into play improved.
XRP 1-week chart
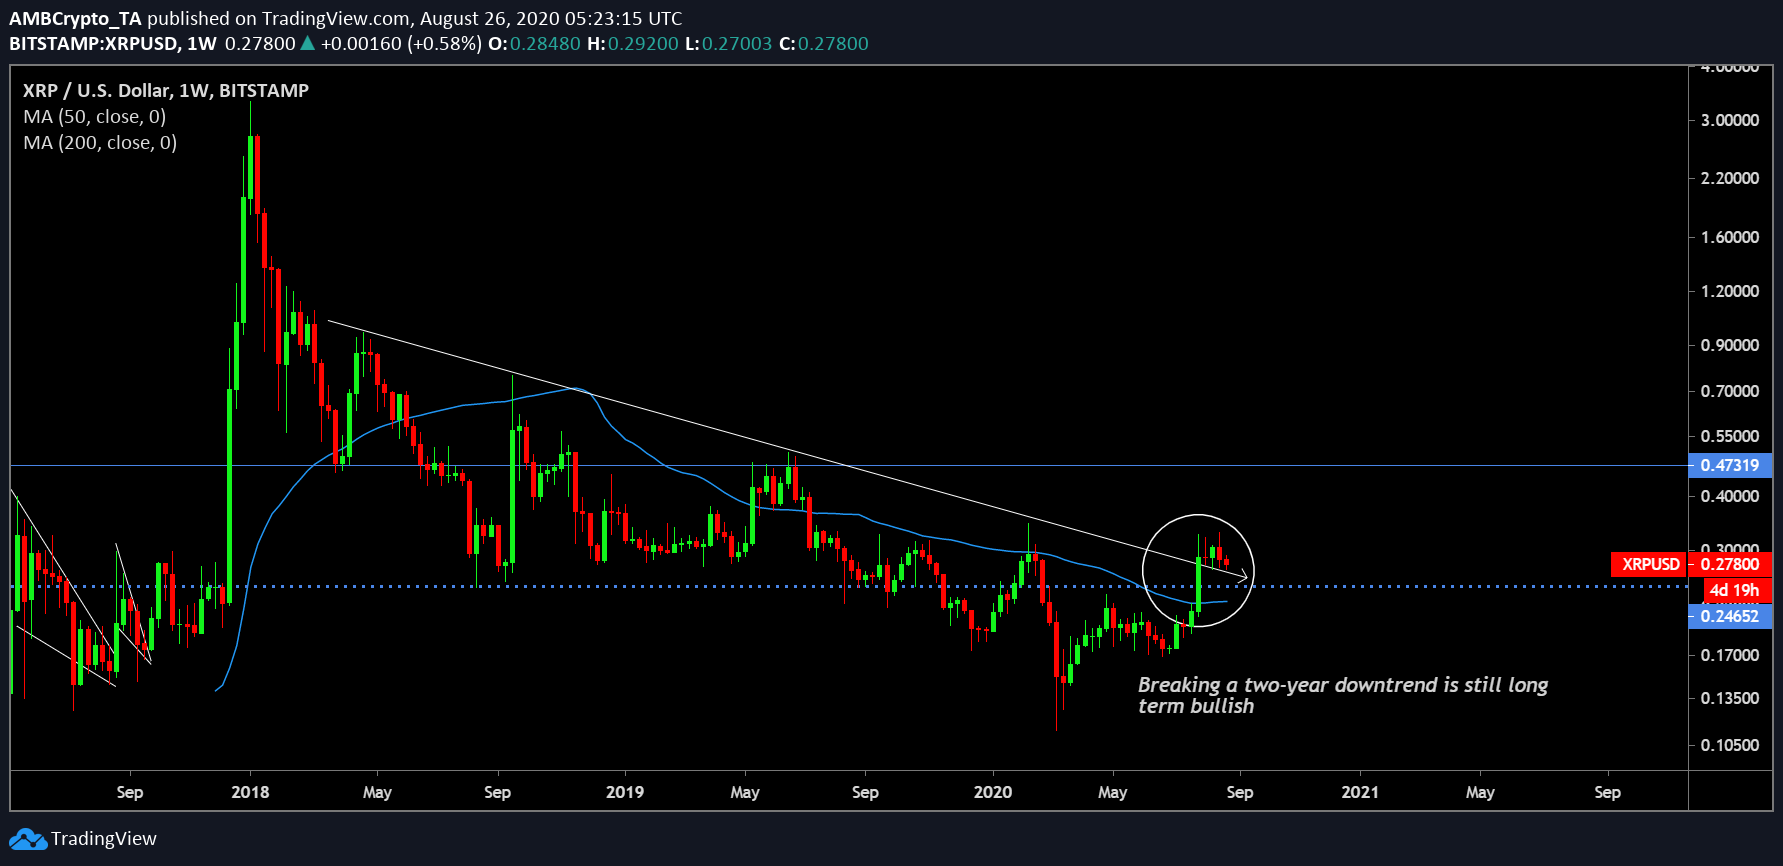
XRP/USD on Trading View
Even though XRP might be looking at another 8 percent drop in the charts, the weekly chart suggested that XRP’s remains safe when it comes to the long-term cycle. XRP’s rally early in August allowed the asset to breach above its 2-year downtrend, which was a positive sign.
Unless XRP’s tumbles below $0.266 and closes a weekly candle under that range, XRP’s long-term scenario remains overall bullish. 50-moving average also became underlying support last month after acting as an overheard resistance since May 2019. Hence, breaking the two-year downtrend is still a positive sign for XRP and only a drastic drop in the charts will possibly alter that scenario.
Conclusion
If the double top pattern is completed, XRP could be looking at a re-test support at $0.246 over the next few weeks.
Disclaimer: The following price prediction should not be taken as investment advice. The prediction should materialize in the next couple of weeks.