
Disclaimer: The following price prediction foresees a little bit of volatility as a breakout may occur under a week.
After its recent ascend to over $0.193, XRP was able to resist an instant correction below the support, but over the past few days, the asset was hinting towards the possibility of a dip. With the collective digital asset market riding a minor bullish wave, it could be minor bump before another surge takes the asset above $0.211 for the first time since May.
At press time, XRP was valued at $0.196 with a market cap of $8.8 billion in the charts.
12-hour chart
Source: XRP/USD on Trading View
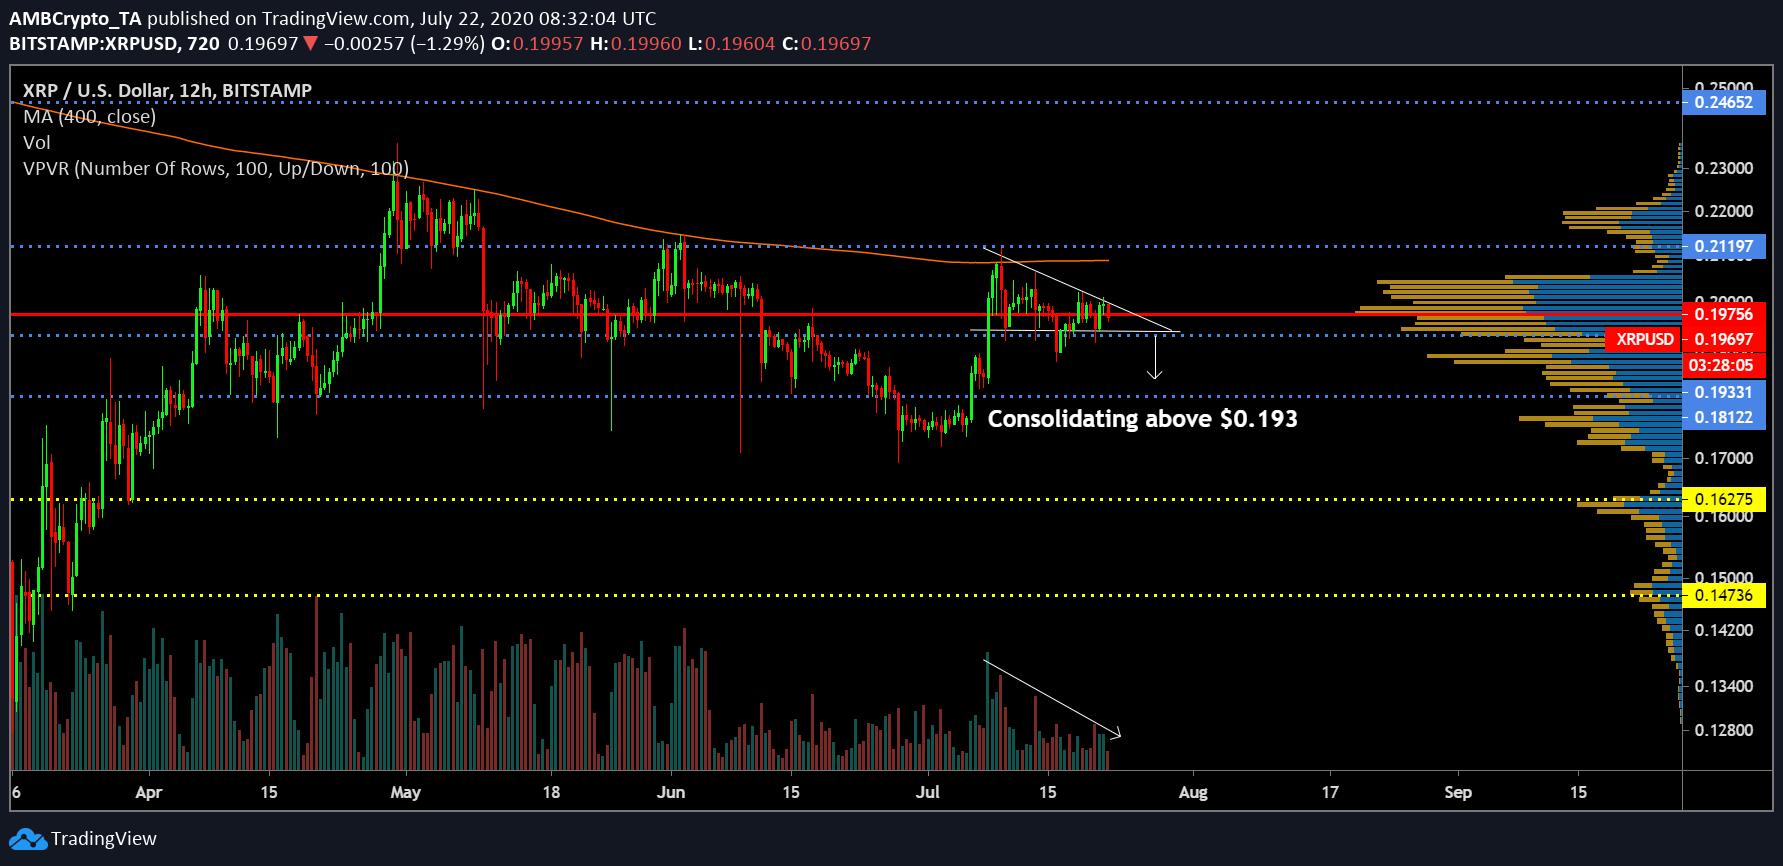
At first glance, XRP’s current price movement is giving rise to a descending triangle, which suggests that the asset may entertain another pullback below $0.193. Considering the asset has been consistently thwarted by the 200-Moving Average over the past month, the consistent selling pressure has been a major factor. However, VPVR suggested that the asset may have found partial support at $0.196 as well, which may assist the token to retain its current position above $0.193.
The depreciating trading volume is not a good sign but it is reaching a point from where a reversal can be expected.
Source: XRP/USD on Trading View
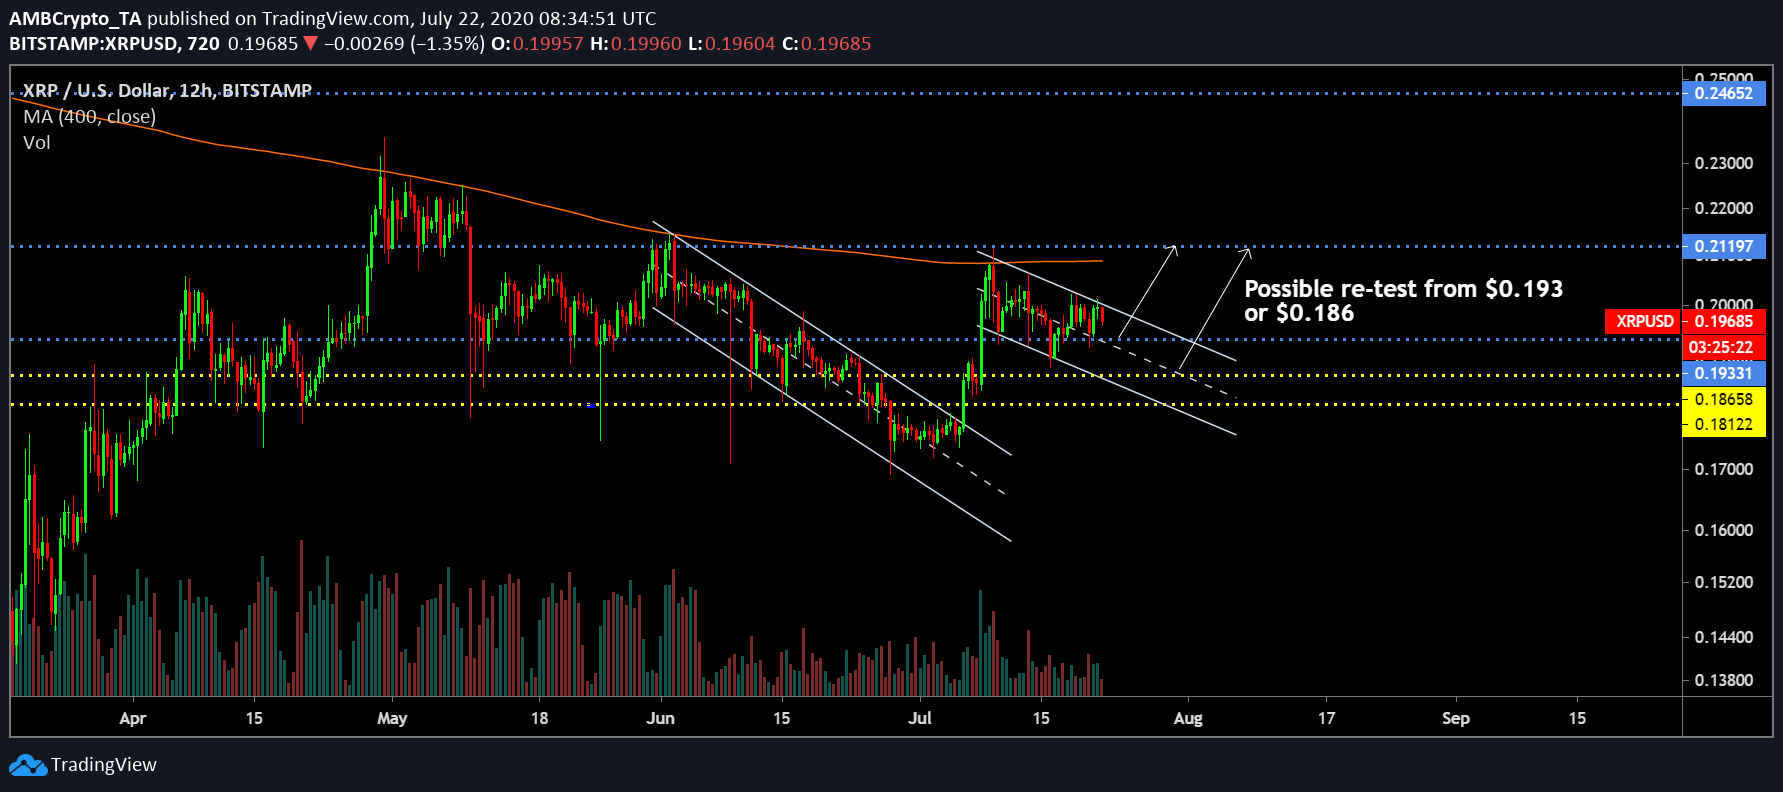
Now, taking an alternative approach to its movement, XRP can also be seen to have oscillated between a descending channel. The price remains towards the upper end of the trendline, which is a positive sign. If a pullback does persist in the charts, a case can be made that immediate bounce-back might take place from resistance at $0.193. A possible climb towards $0.211 remains a fairly achievable target but the presence of overhead resistance at $0.20 may have a part to play.
Improving bearish pressure could also take the valuation down to $0.186 before it catches another bullish wind.
Source: XRP/USD on Trading View
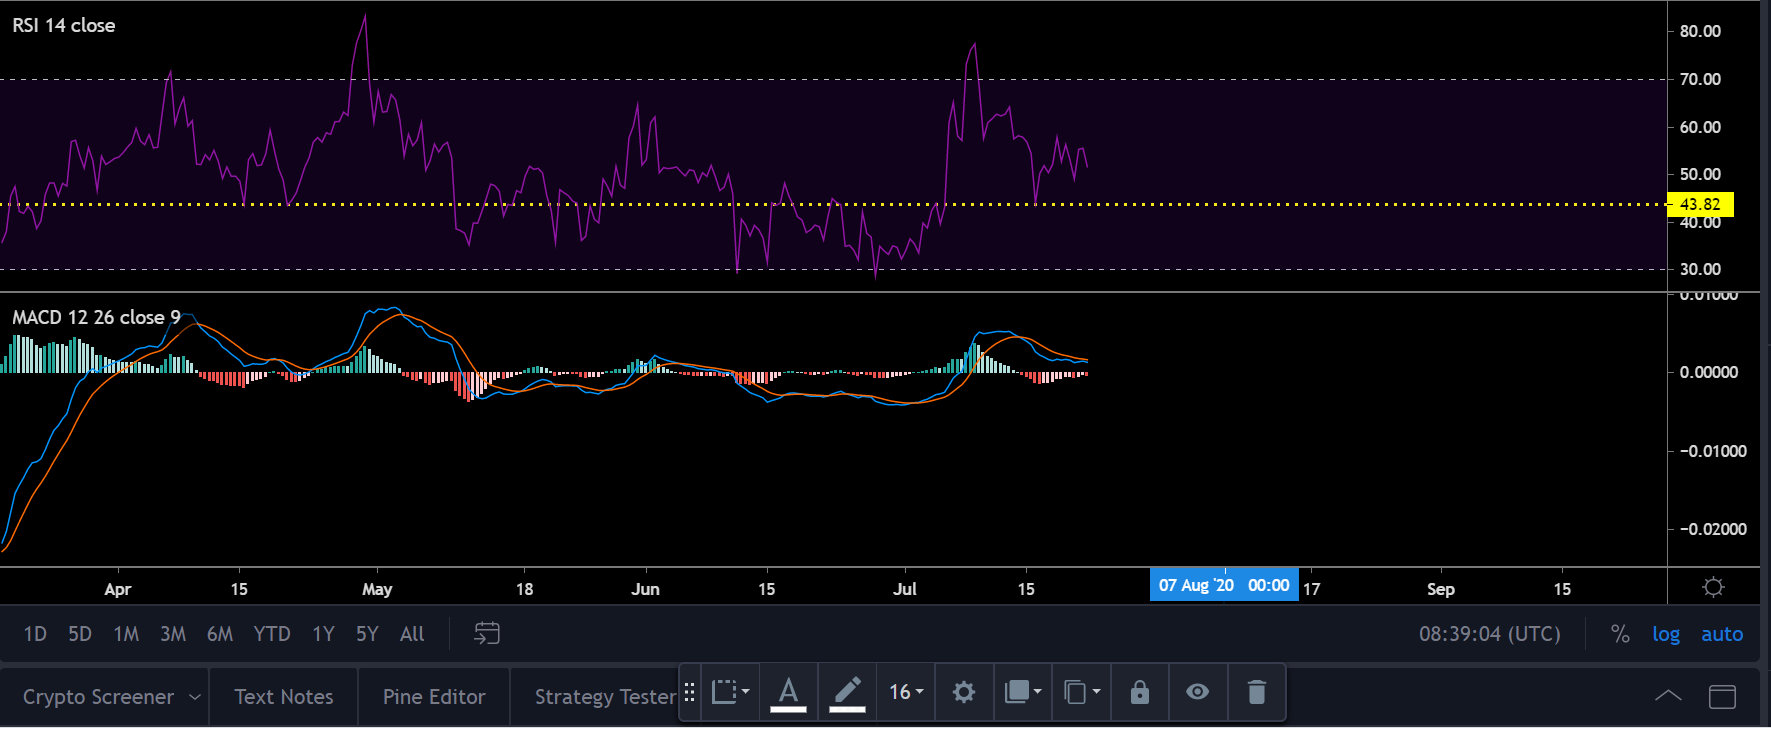
Market Indicators remain contradictory for the asset. MACD, even though bearish, indicated the potential for a bullish reversal as the blue line and red line maintained close proximity in the charts. Relative Strength Index or RSI is on a decline at the moment, exhibiting pressure from the seller but unless the index drops below 43, a bullish outcome is still in the cards by the end of July.
Conclusion
XRP’s price may attain another bullish rally towards $0.211 but an imminent re-test at $0.193 or $0.186 may take place over the next 10-14 days.