
Disclaimer: This article attempts to analyze XRP’s price movements over the course of a month, leading up to a potential breakout in the third week of July.
XRP was being traded at $0.195, following a minor surge of 1.94% over the last 24-hours, at the time of writing. On the cryptocurrency charts, the coin had slipped to the fourth position after Tether overtook it to become the third-largest cryptocurrency by market cap. Soon after, selling pressure squeezed the coin’s prospect of any upward price action. However, the charts below suggest that a potential trend reversal could be on the cards for XRP.
XRP Daily Chart
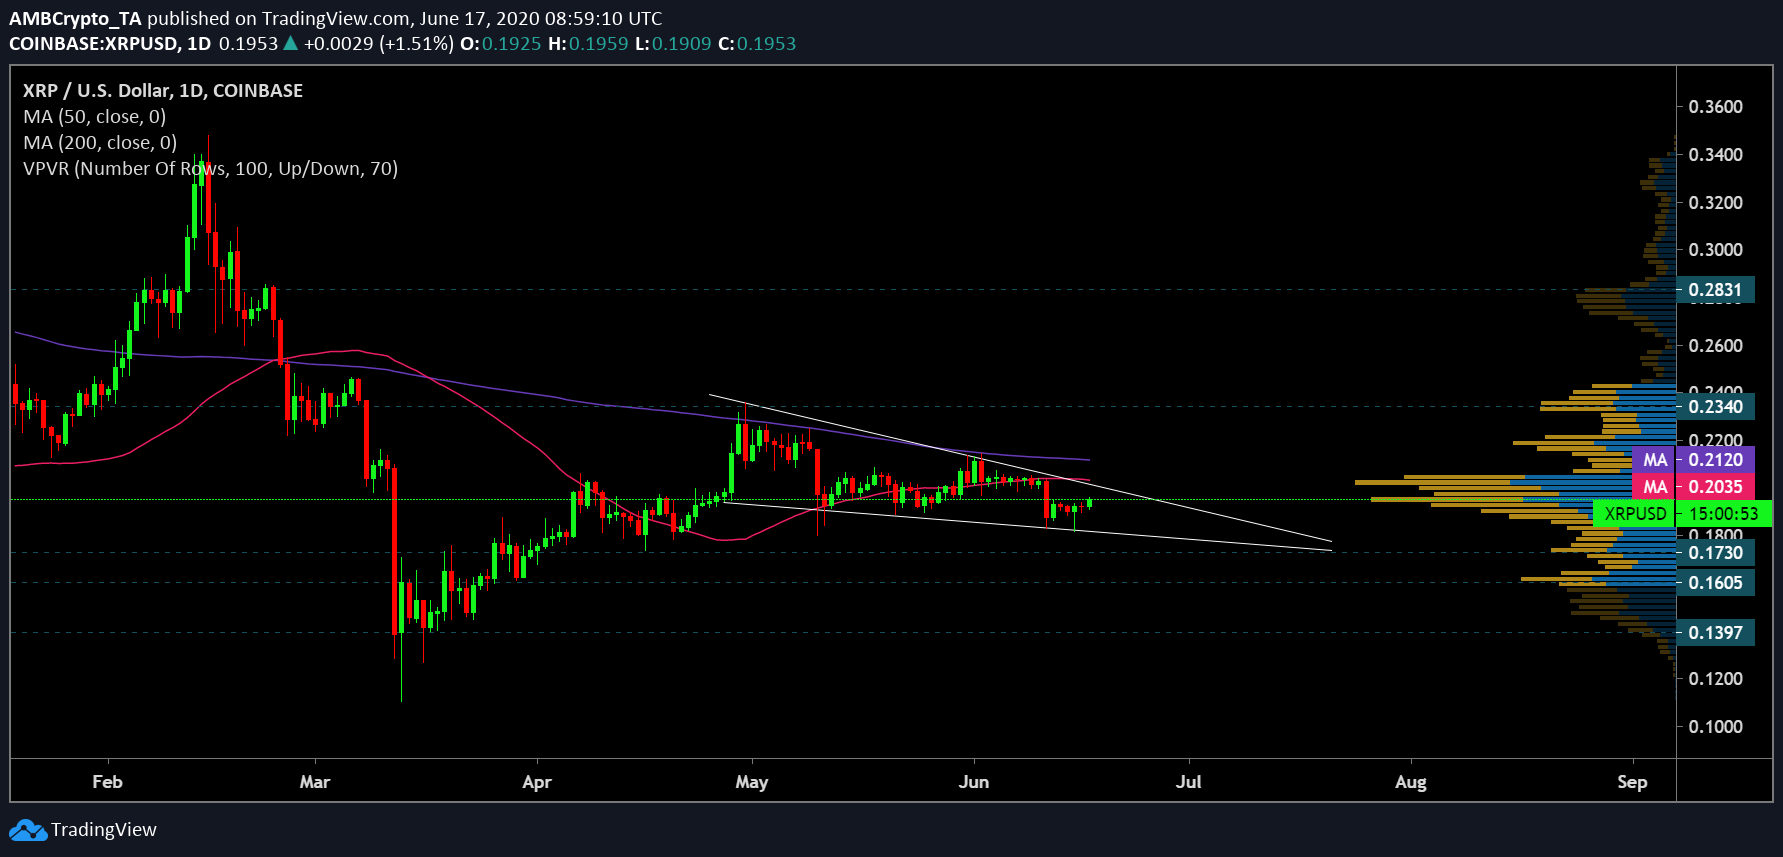
Source: XRP/USD on TradingView
XRP’s price noted multiple onslaughts as critical supports couldn’t help the price from tumbling over the last couple of weeks. This was evident on the daily charts where XRP’s price candles were observed to be oscillating between the trendlines of a falling wedge, a pattern that first started taking shape on the 27th of April. The completion of this pattern is expected to take place in the last week of July, a breakout from which is expected to happen on the upside.
A positive trend in the long-term was also highlighted by the two daily moving averages. The 50 DMA [Pink], which was hovering below the 200 DMA [Purple], climbed as it neared the latter. The decreasing gauge was indicative of a potential reversal in bearish pressure in the XRP market.
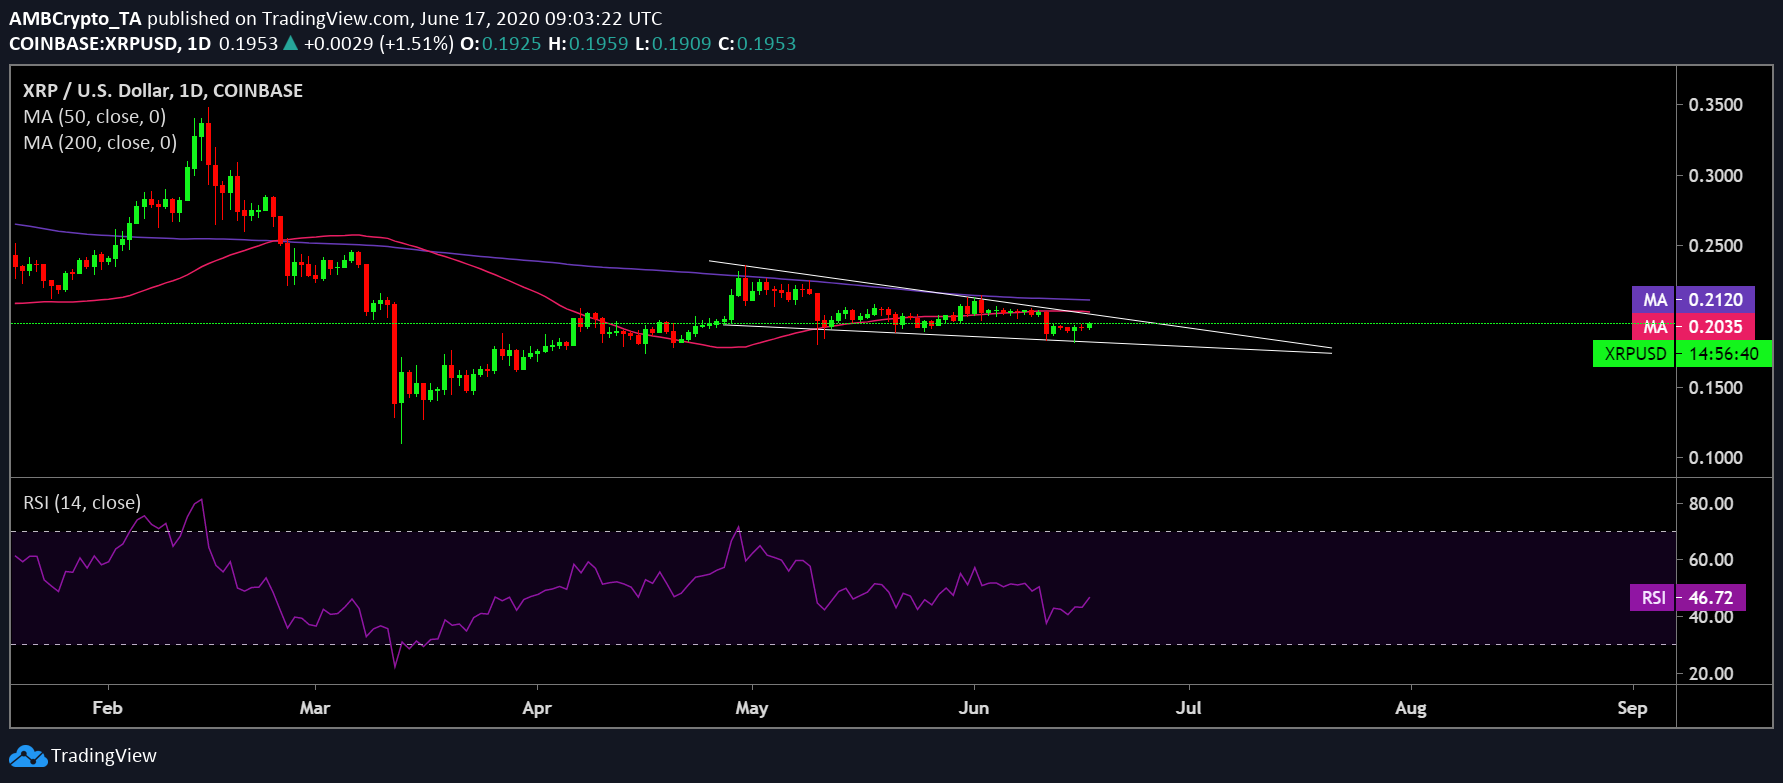
Source: XRP/USD on TradingView
Further validating a degree of bullishness in the long-term were the buyers appearing on the chart of XRP. Closely following the coin’s retracement to its lows last week, the RSI also noted a dip below the 50-median, pointing towards an increased selling pressure sentiment.
However, as the coin recovered from the local bottom of $0.180 on the charts, so did the indicator, which shot back up close to the median. Thus, the upward-pointing RSI essentially signaled a substantial decline in the selling pressure among investors in the coin market.
If the breakout materializes, it will potentially confirm the coin’s move to the upside and target the resistance point formed by the 200 DMA at $0.212. If the buyers further succeed in pushing the bears out, the coin could further climb to the subsequent point of resistances at $0.234 and $0.283, respectively, in the last of July, as suggested by the VPVR indicator as these levels have high trading activity.
On the contrary, signs of bearish breakout appeared bleak as it found crucial support at points $0.173, $0.160, as pointed out by the VPVR, as well as $0.137, a level unseen since the Black Thursday crash.