XRP long-term Price Analysis: 15 July

Disclaimer: The following price prediction should materialize over the next two weeks.
When XRP registered a recovery of 103 percent after its price drop on March 13th, many were expecting it to follow into the footsteps of other major assets. The likes of Bitcoin, Ethereum were able to ascend near their early highs of 2020, and Cardano was even able to exceed its highs from February. However, for XRP, the decline has been prominent since reaching $0.23 on April 24th, and the struggle has been consistent over the past few months.
12-day chart

Source: XRP/USD on Trading View
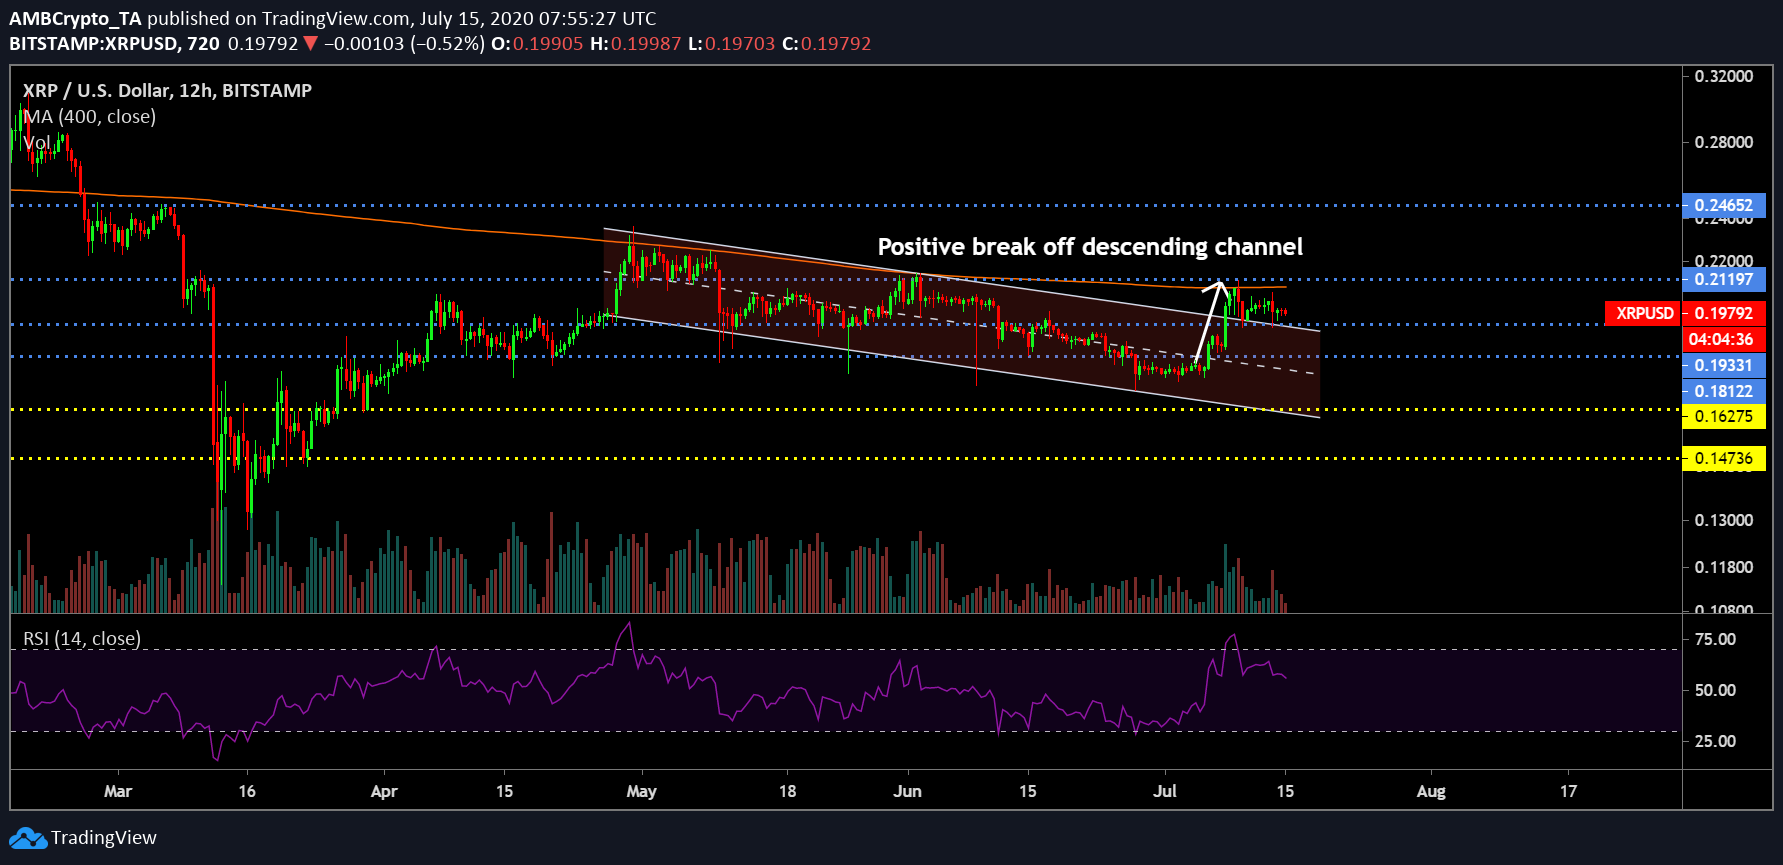
XRP’s recent price movement would have intrigued its proponents as the token exhibited a bullish breakout from its descending channel pattern. On 6th and 8th July, XRP marched above the resistance at $0.181 and $0.193 respectively, and the 4th largest token was able to sustain a position above the $0.193 range. A bullish direction after a period of 78 days was welcome by the users and at the time of writing, the asset mediated between the price of $0.21 and $0.193.
Trading volume has remained consistent over the hiking period and Relative Strength Index or RSI suggested that buying pressure is currently taking control in the market. However, the elation attached to a market turnaround could be fairly short-lived if the next pattern breaks through.
1-day chart

Source: XRP/USD on Trading View
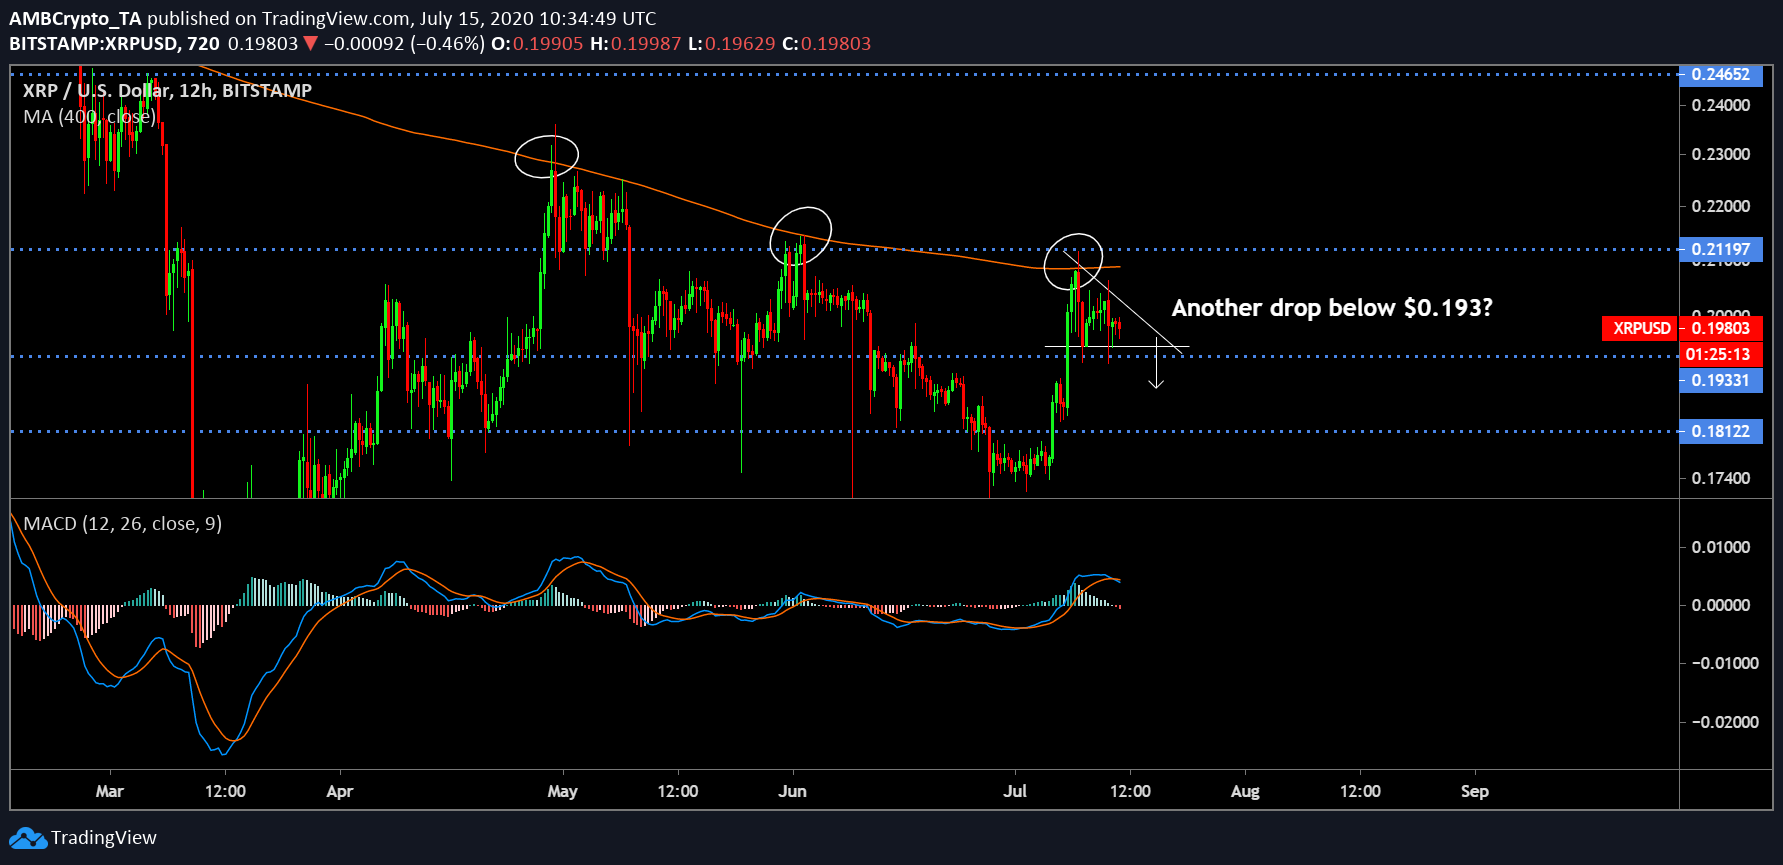
XRP’s major hindrance over the last couple of months has been the 200-Moving Average. The overhead resistance prevented the token to hike above a certain level on March 5th, 29th April, 2nd June and now 9th July, as illustrated in the chart above.
So the strength of the resistance is unquestioned at the moment and it might take more than just a short-term rally to break it. However, XRP’s price is oscillating under a descending triangle pattern at press time. The breakout from this pattern is inclining towards a pullback and by the end of July, XRP could be well on its way below support at $0.193 once again.
With MACD line turning bearish in the charts, a sense of optimism will start to dwindle among the traders, and before time, rising in selling pressure will possibly take over.
Conclusion
XRP will drop under $0.193 over the next two weeks, possibly by 26th July.


