
Bitcoin crashed by 15% over the last 3 days. However, the crash on 26 February was brutal as it pulled down the price from $9,369 to $8,627, triggering liquidations worth millions. The price continued its crash onto the next candle, pushing even lower [$8,520]. At press time, Bitcoin was hovering at the $8,804 level, with the bleeding showing no signs of stopping.
As Bitcoin tries to resuscitate itself from the collapse, it is important to look at what to expect next from Bitcoin.
A deeper collapse or a surge to mitigate losses?
Weekly Chart
Source: BTC/USD on TradingView
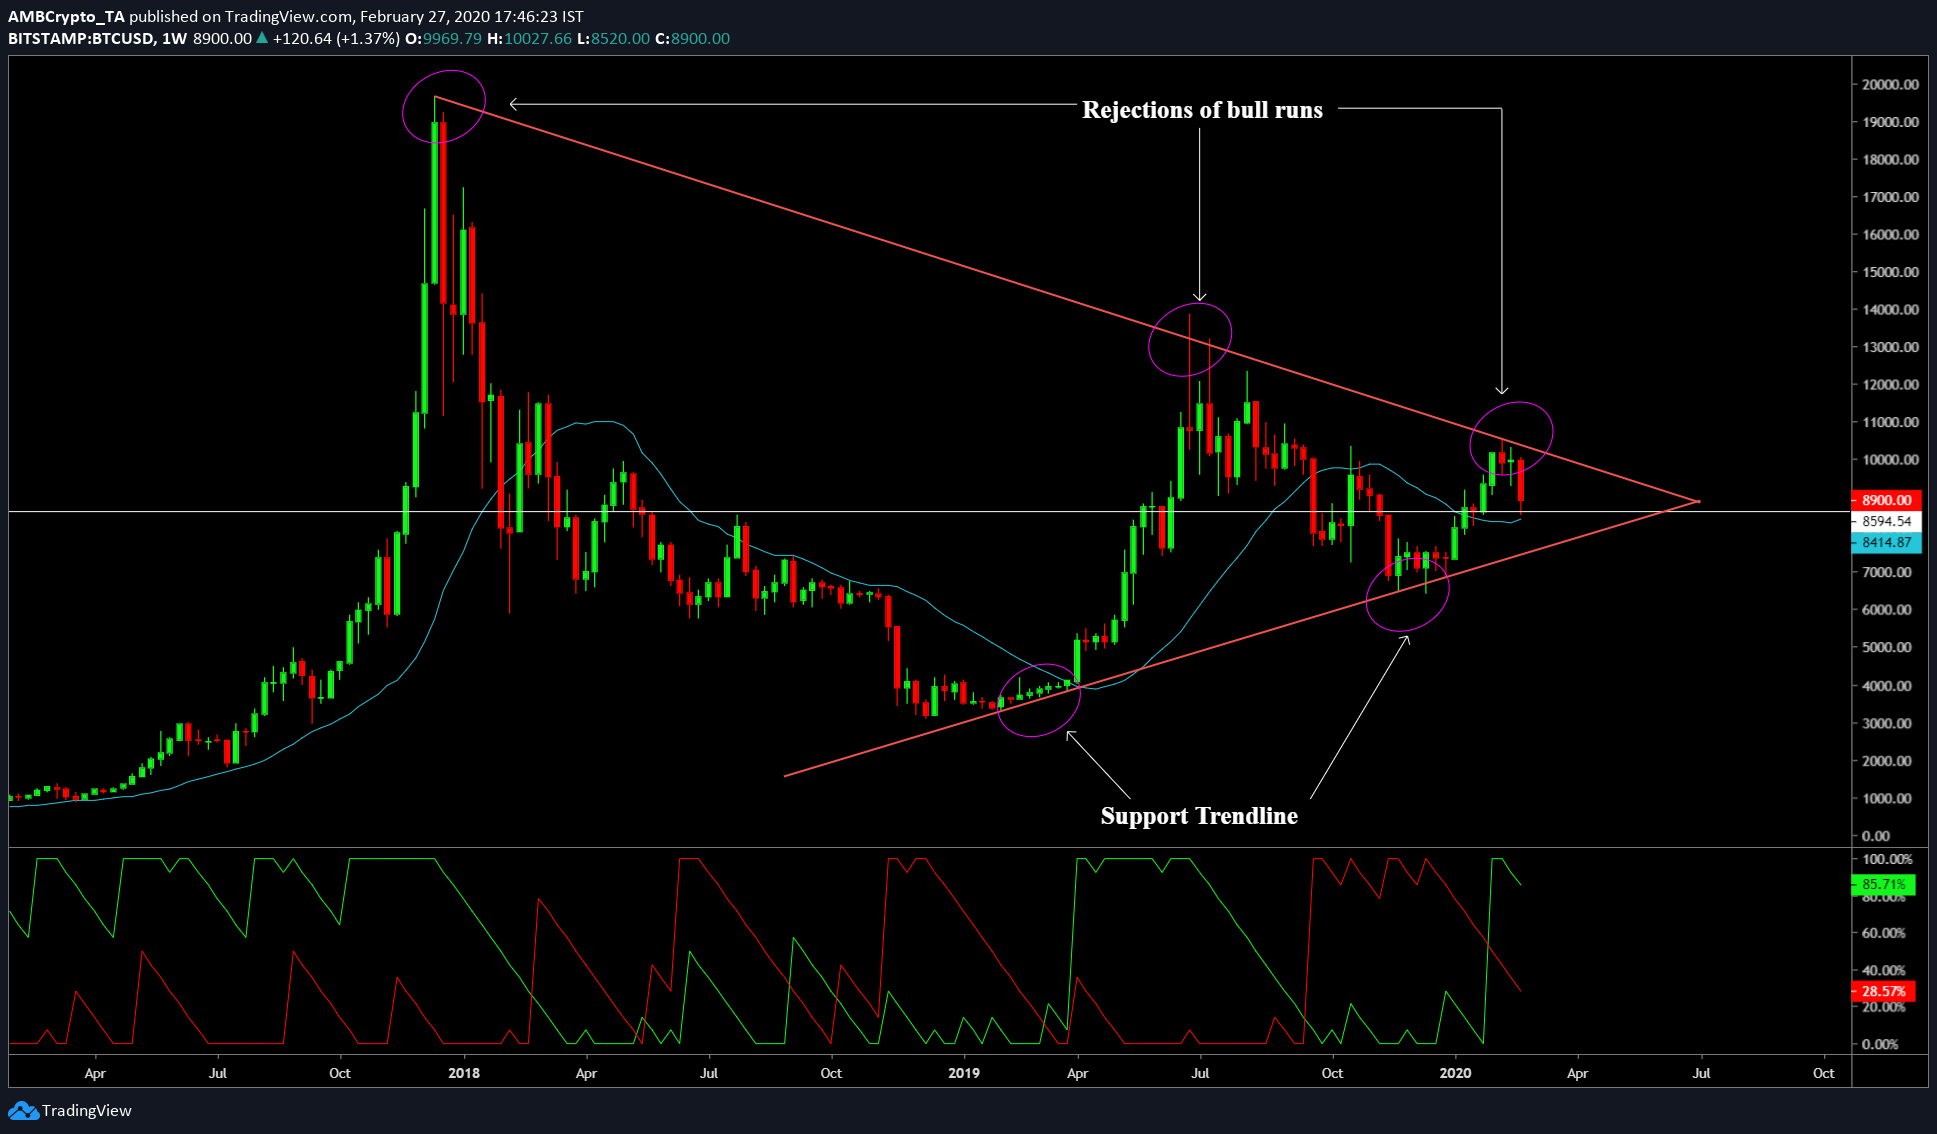
The weekly chart for Bitcoin showed important levels to keep an eye out for. Right off the bat, Bitcoin is stuck bouncing between the two trendlines, one extending all the way back to December 2017.
The June 2019 rally and the February 2020 rally were both successfully prevented from happening by this downtrend. Further, the uptrend extending from early 2019 to press time has prevented the price from collapsing lower. Together, these lines form a symmetrical triangle and perhaps, the biggest pattern in Bitcoin’s history.
As it stands, Bitcoin’s important level would be $8,594; following this is the 21 weekly moving average [WMA] which is at $8,414 [blue]. Breaching these levels would be an absolute catastrophe for Bitcoin’s rally.
Unfortunately, things do not look good for Bitcoin. The Aroon indicator showed that the uptrend hit a peak and had started its retracement. However, the bearish aspect of the Aroon indicator is its downtrend, which showed that there is more room to move downward, indicating further bearish presence. Hence, a drop to the 21 WMA i.e., $8,414 can be expected. A further drop would take Bitcoin to $8,059.
The 3 remaining days for the weekly candle to close will fit this drop, which makes this week’s close an important one.
Daily Chart
Source: BTC/USD on TradingView
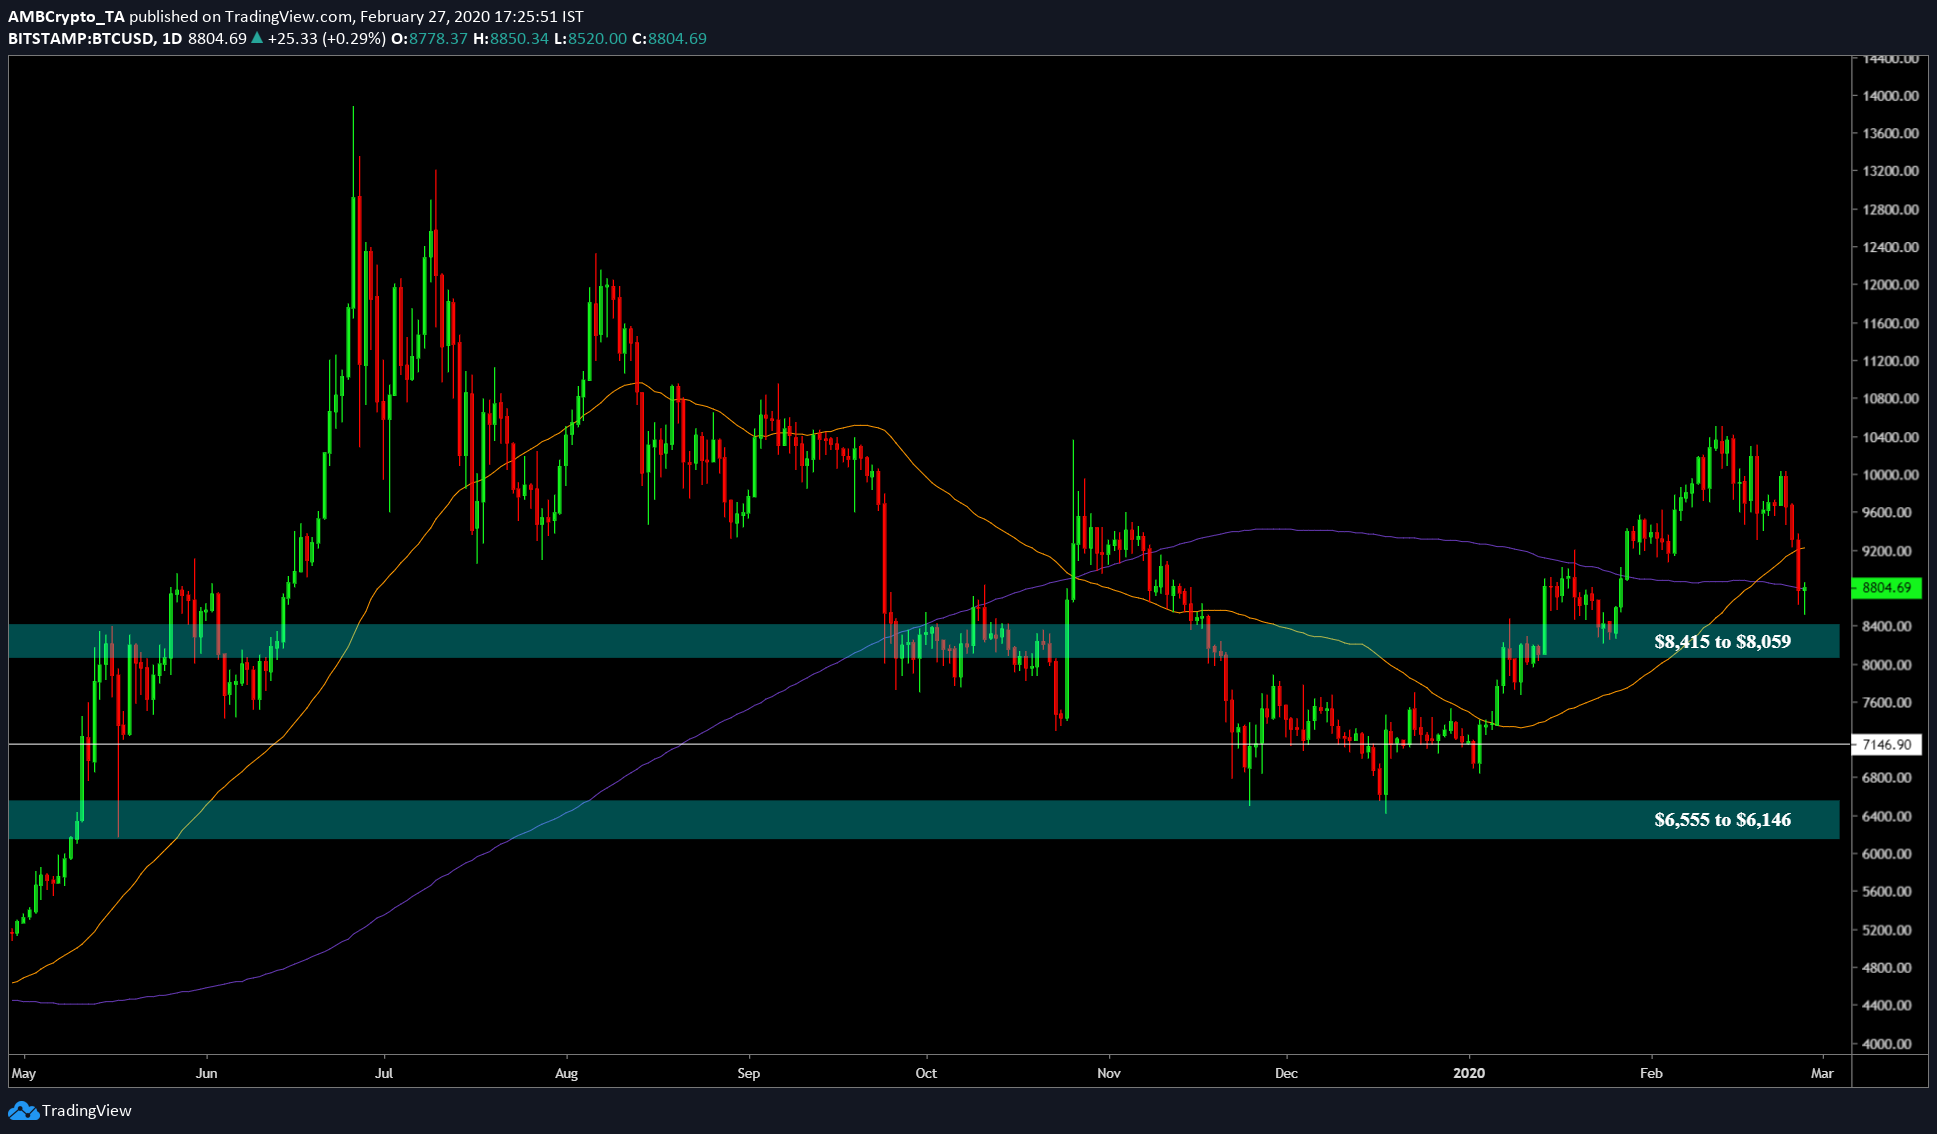
Unlike the weekly chart, the daily chart looks quite bullish, or at least in the short-term. However, like the weekly chart, the daily close of today’s candle is important in determining where the price moves. At press time, there was a dragonfly doji, indicating a reversal.
Unless the price doesn’t drop into the immediate resistance zone extending from $8,415 to $8,059, BTC will be fine. The retracement from here would take the price above the 200-day moving average [DMA] and perhaps, towards the 50-DMA, which is comfortably above $9,200.
Conclusion
Both the weekly and daily charts for Bitcoin showed that the close of their respective timeframe candles is important. However, the daily chart looks more bullish than the weekly chart. If the daily close doesn’t close above the 200 DMA, it could spark the downward movement spoken about in the weekly chart section.