Bitcoin broke past $12,000 and was trading at $12,200 when the news broke that Paypal would enable its nearly 350 million users to settle transactions using Bitcoin, Ethereum, Litecoin, and Bitcoin Cash in 2021. An hour past the news and Bitcoin surged to $12,430. Polkadot was trading inside a continuation pattern. Compound continued to trend lower while Algorand exhibited a bullish divergence.
Polkadot [DOT]
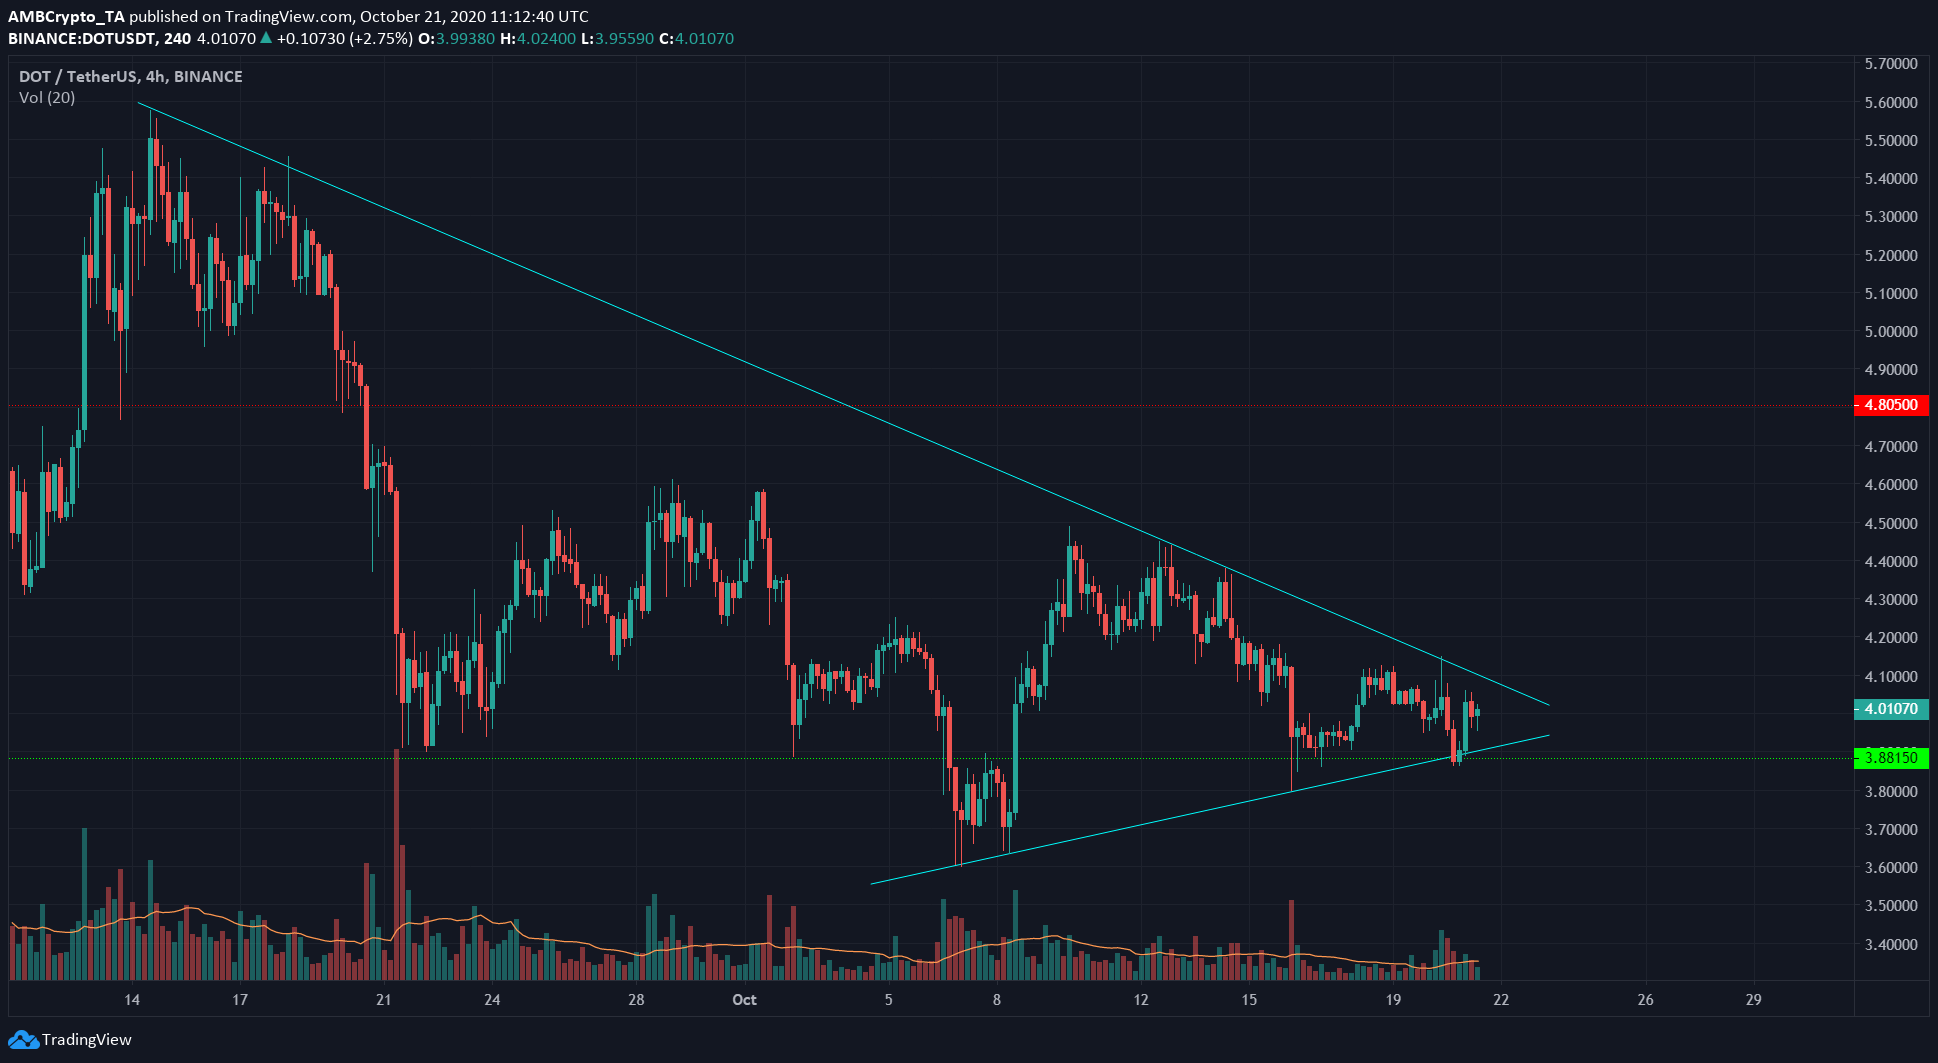
Source: DOT/USDT on TradingView
Polkadot formed a symmetrical pattern (cyan), a continuation pattern that generally sees the price resume the prior trend. Trading volume when within the pattern has also been low for the most part for DOT.
A close above or below the pattern would give a sense of the next direction for the market, but the price can also breakout one way, reverse and head in the opposite direction, trapping traders who entered upon breakout.
Polkadot also appeared likely to dip toward $3.5 before a recovery past the $5 region in long-term analysis.
Compound [COMP]
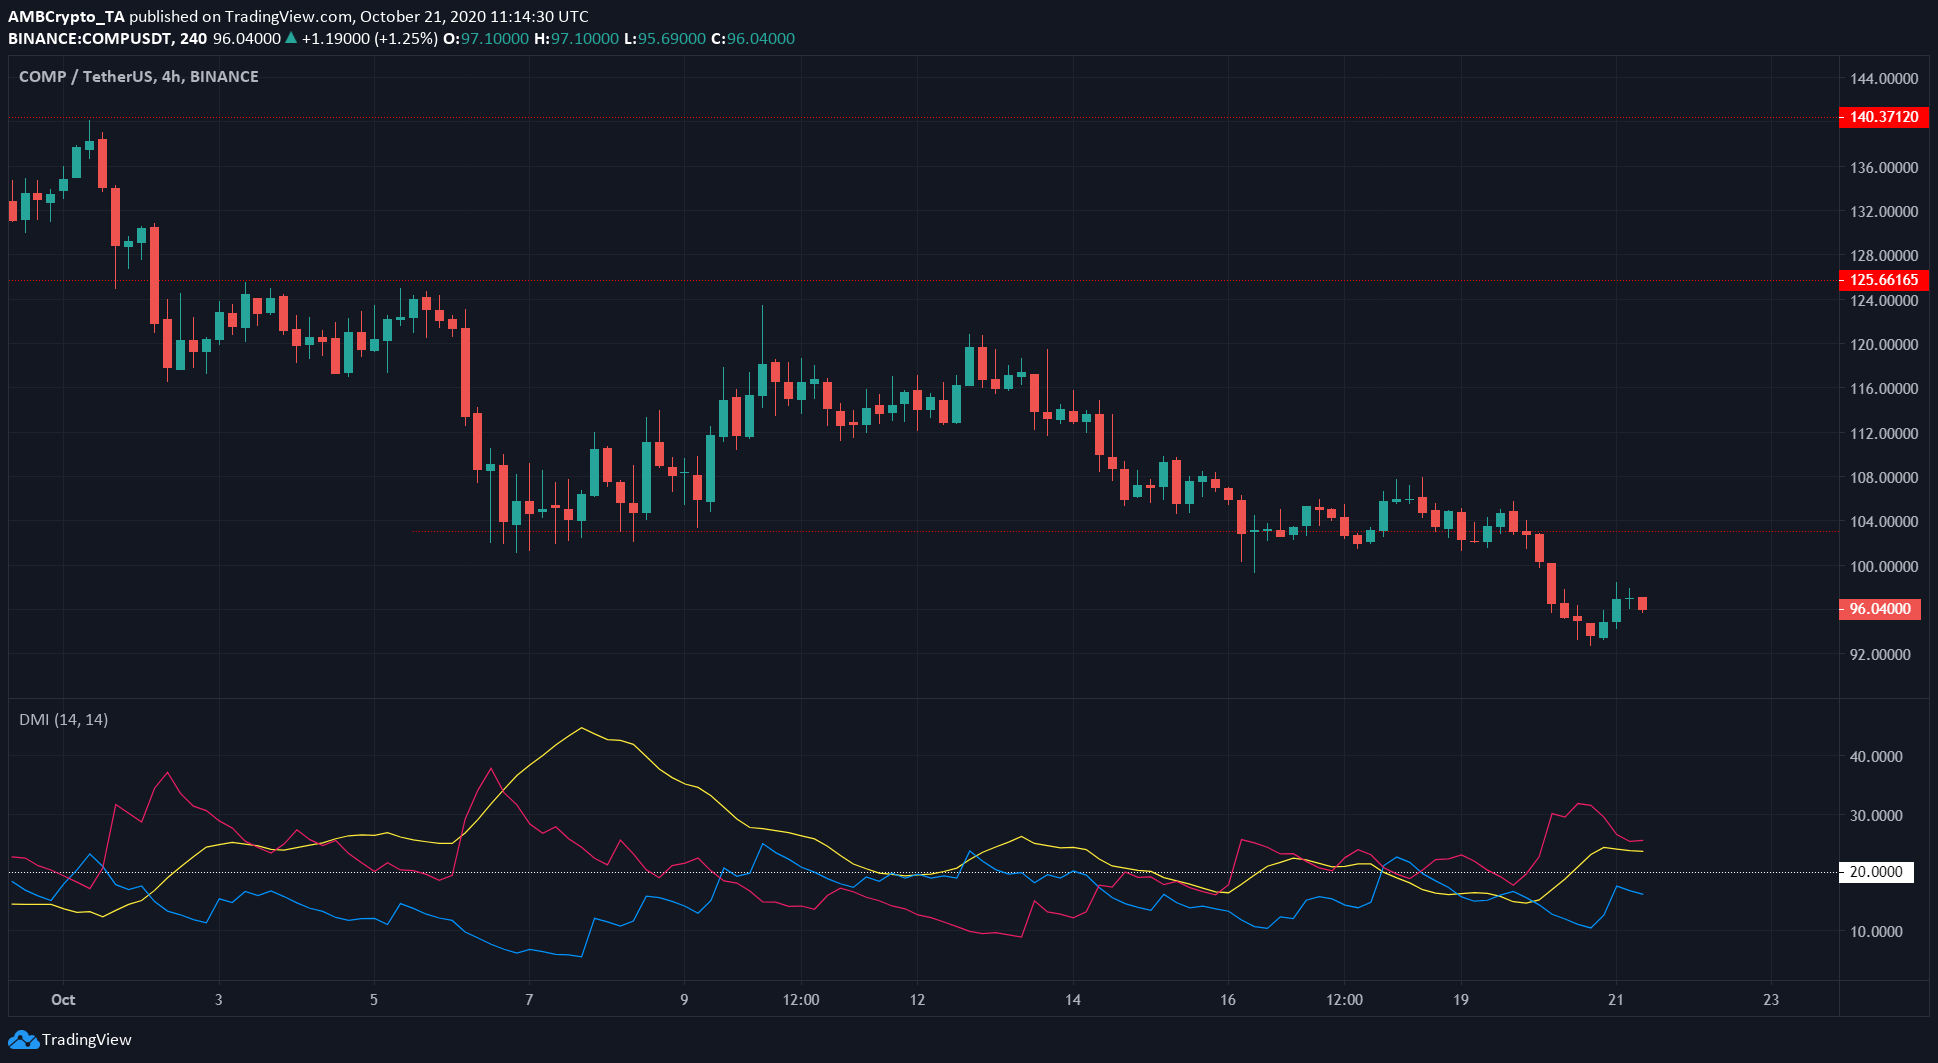
Source: COMP/USDT on TradingView
COMP continued to register lower highs as the bearish pressure refused to cede any ground for the asset to find purchase upon.
The Directional Movement Index [DMI] showed that a strong bearish trend was in progress as the ADX (yellow) moved past 20. -DI (pink) highlighted the trend’s bearish nature.
Algorand [ALGO]
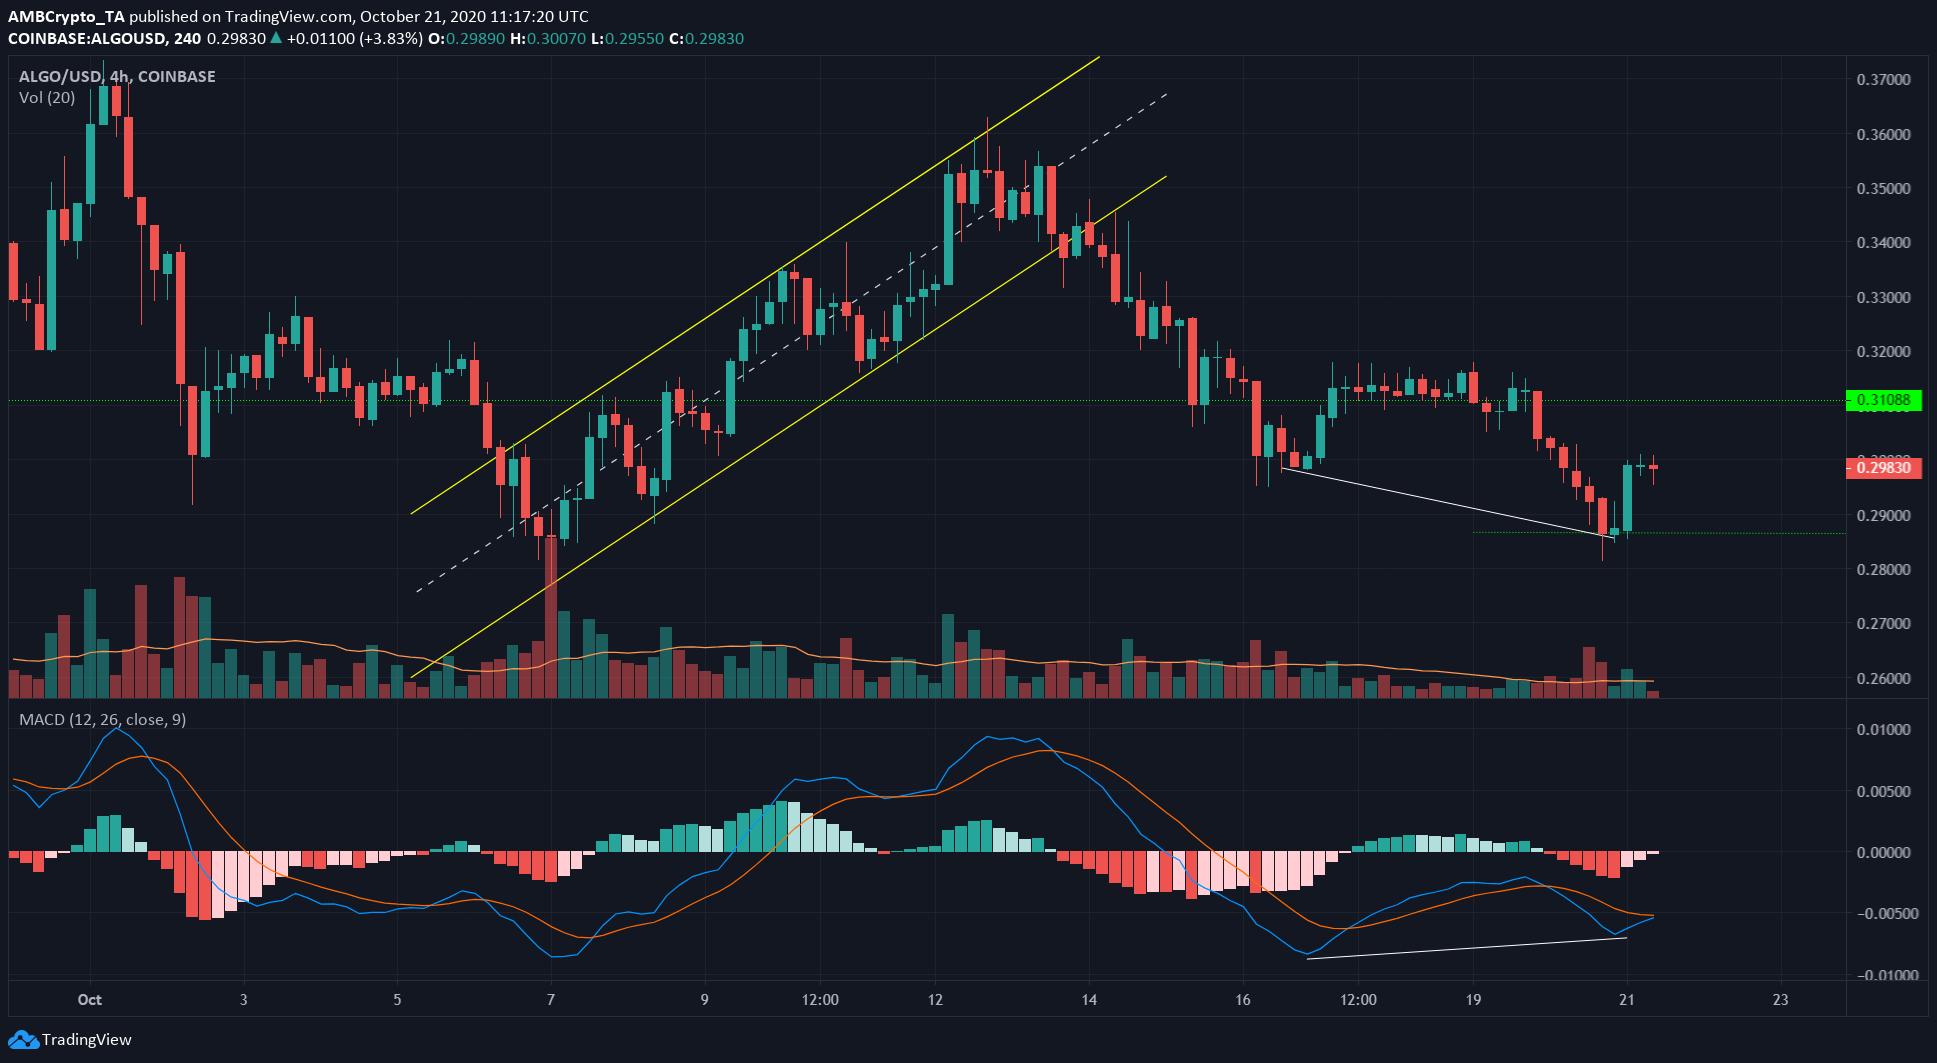
Source: ALGO/USD on TradingView
ALGO was moving in an ascending channel (yellow), broke out to the downside, and lost $0.31 as support. The price retested the same level as resistance as well, before dipping to $0.286.
The MACD was in bearish territory, and the MACD line (blue) moving beneath the signal line (orange) indicated a sell signal.
However, a bullish divergence (white) was spotted, where the price made a lower low but the momentum indicator made a higher low. This suggested that the asset was due for an upward correction.
At the time of writing, the price was at $0.298 but could be set to move upward by a few more percentage points.