- Polkadot and Cardano topped the dev activity count of the last 30 days.
- DOT and ADA saw increased price improvements in the last 48 hours.
Over the past 30 days, Polkadot [DOT] and Cardano [ADA] have ranked as the top networks in development activity. Despite sharing many similarities in their development efforts, their respective price trends were different.
Polkadot and Cardano show strong dev activity
A recent chart by Santiment showed that, on the 29th of November, Polkadot was in first position in terms of dev activity, while Cardano followed closely behind in second place.
Notably, this marked the first time in over two months that Polkadot outpaced Cardano in dev activity.
But despite their similar rankings, Polkadot and Cardano have experienced different trends in the number of core developers involved.
Polkadot shows a stronger core developer number
Data from DefiLlama showed a notable difference in the monthly developer counts between the two networks. Polkadot recorded around 127 developers for November. This was more than Cardano’s count of 29 developers.
However, despite this difference, both networks have generated nearly the same levels of development activity. Although Cardano was behind in core developer and developer activity counts, it still boasted of a positive development.
Notably, AMBCrypto’s analysis of the DefiLlama chart showed a recent increase in Cardano’s Total Value Locked (TVL). It reached over $260 million at press time, marking the highest figure in over a year.
DOT and ADA rally in the last 48 hours
Over the last seven days, Polkadot has generally seen a positive price trend, except for a 3% decline on the 27th of November. However, AMBCrypto’s look at the daily timeframe showed a rise of over 3% in the last 48 hours.
This brought DOT’s trading price to around $5.3. Notably, the short-moving average (yellow line) was going upward at the time of writing. However, the yellow line was still positioned below the price trend.
This indicated that the trend has yet to gain significant strength.
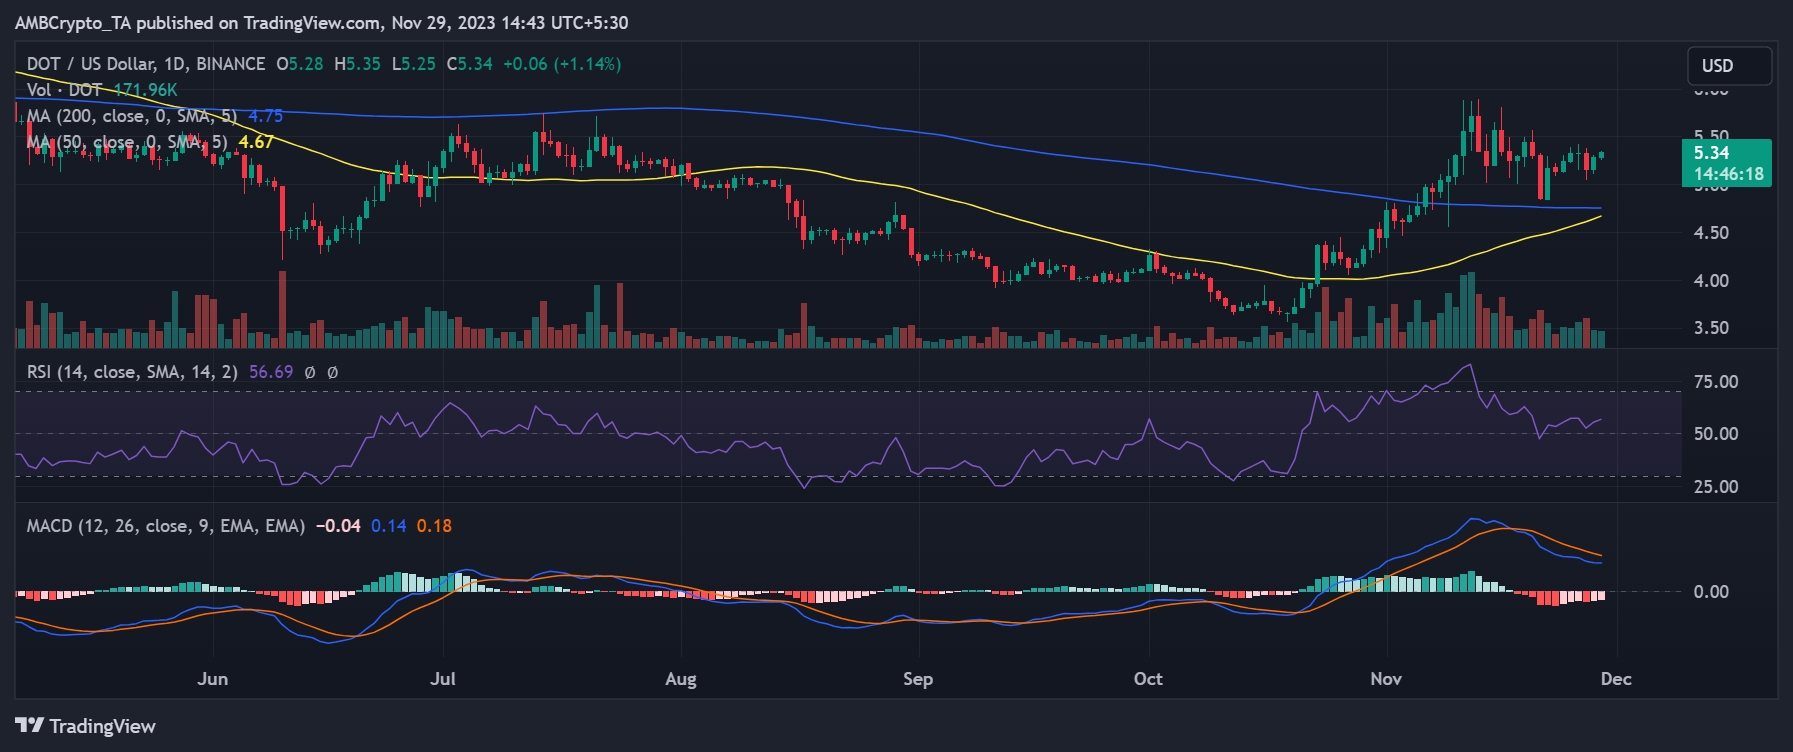
Source: TradingView
Is your portfolio green? Check out the DOT Profit Calculator
On the other hand, Cardano has faced challenges in maintaining a positive price trend over the past seven days. It has seen more declines than increases.
However, the last 48 hours have shown improvement, with a gain of over 2%. As of this writing, it was trading at around $0.38. Similar to Polkadot, Cardano’s short moving average was below its price movements.
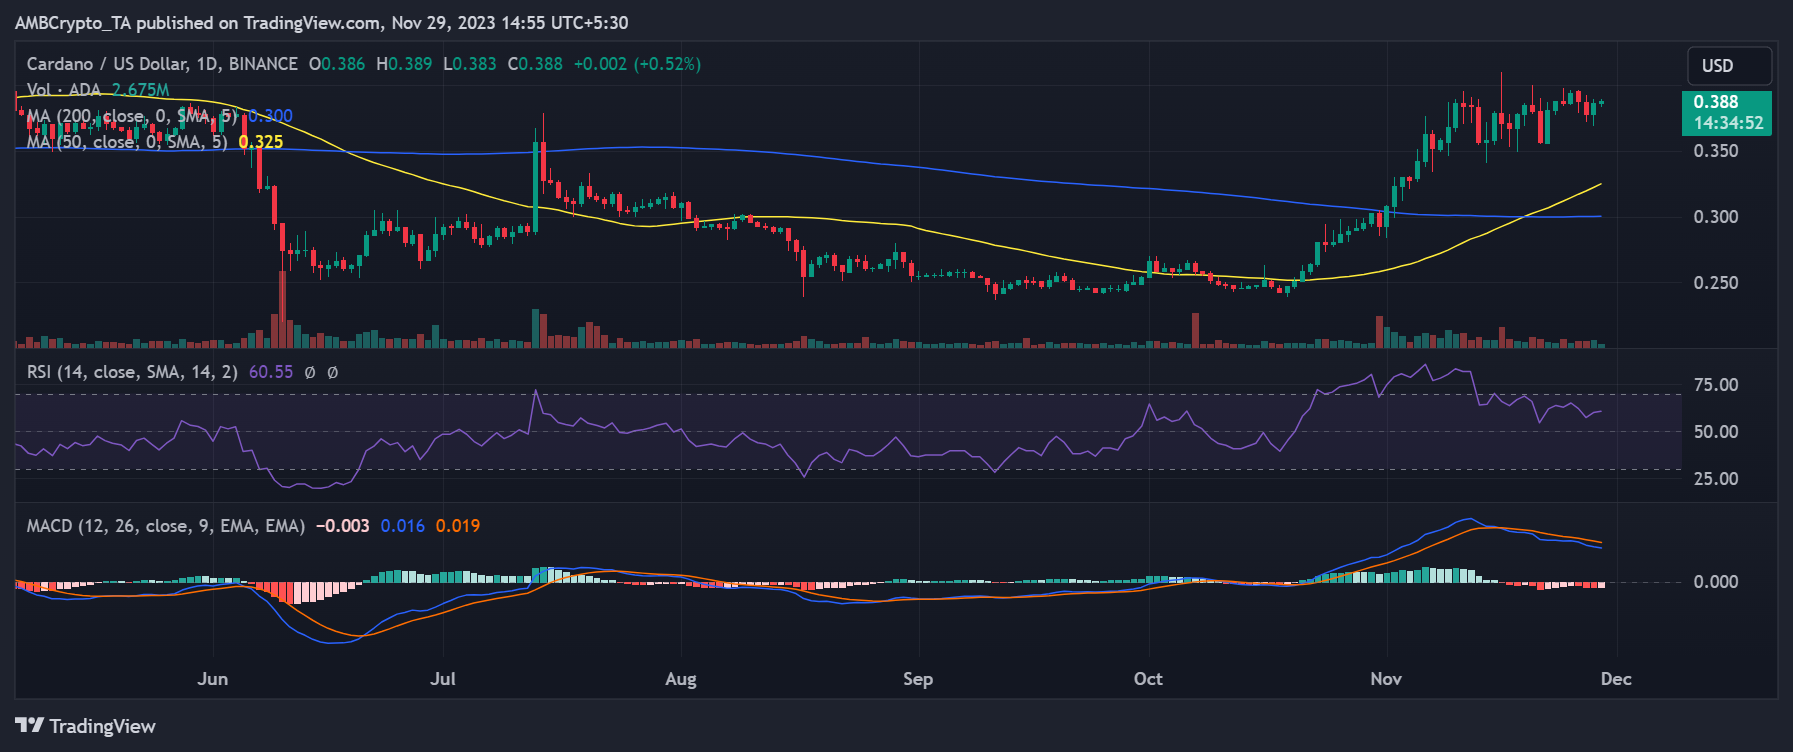
Source: TradingView