Disclaimer: The information presented does not constitute financial, investment, trading, or other types of advice and is solely the writer’s opinion.
- DOT was trading just under the $5.5 level but another boost higher could be expected.
- The quick recovery after the dip to $5 was an encouraging factor for the buyers.
Polkadot [DOT] has posted huge gains in recent weeks as the altcoin market began to heat up. However, the social metrics for the token were underwhelming. Its development activity remained high and gave investors confidence.
Technical analysis of DOT showed that despite the volatility witnessed in the past two days, the bulls were still in control. A critical level of resistance continued to stand strong, but the sellers were weakening.
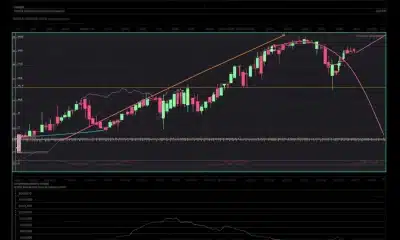
The pullback came as low as $5 before another bounce

Source: DOT/USDT on TradingView
The daily market structure remained firmly bullish. The RSI was at 67 to reinforce the idea that bulls were in control. The On-Balance Volume shot above February highs to underline the intense buying pressure in recent weeks.
The Chaikin Money Flow (CMF) also signaled enormous capital inflow to the DOT markets.
The $5.3-$5.56 region was a bearish order block on the one-day chart since late May. DOT managed to close a daily trading session above it on 12th November, breaking it as a resistance zone. The subsequent pullback reached $5 but saw a sharp bounce very quickly.
The Fibonacci retracement levels at $4.73 or lower were not tested. This was another sign that buyers were dominant and that market conditions favored shallow pullbacks at the moment. To the north, the $6.2 and $7.05 levels would likely be tested next.
Are we on course to get another sweep of the $5 region?

Source: Hyblock
AMBCrypto’s analysis of Hyblock data revealed that another drop to the $4.9-$5 region would not be surprising. Whether it comes before a move to the $6 region or after remains to be seen.
Read Polkadot’s [DOT] Price Prediction 2023-24
The liquidation data of the past seven days showed that $5 and $6 remain the imminent areas of interest.
A move to $6.2 would be a sign that $7 was next. Traders will need to beware of volatility since a large chunk of liquidations could be hit just above the $6 mark.