Polkadot has struggled somewhat to record a surge in price after the DeFi craze died out. However, the cryptocurrency seems to have good potential for a scalp, but the bulls need to pull through for the same as this pump isn’t going to be easy.
At press time, DOT was barely holding above $4, and considering today’s dump, the price might go under the $4-level. Ranked as the eighth-largest cryptocurrency in the world, DOT noted a 5.3% drop in the last 24 hours, with more yet to come.
The following article tracks the possible movements of DOT on a long-term basis.
DOT 1-day chart
Source: DOTUSD on TradingView
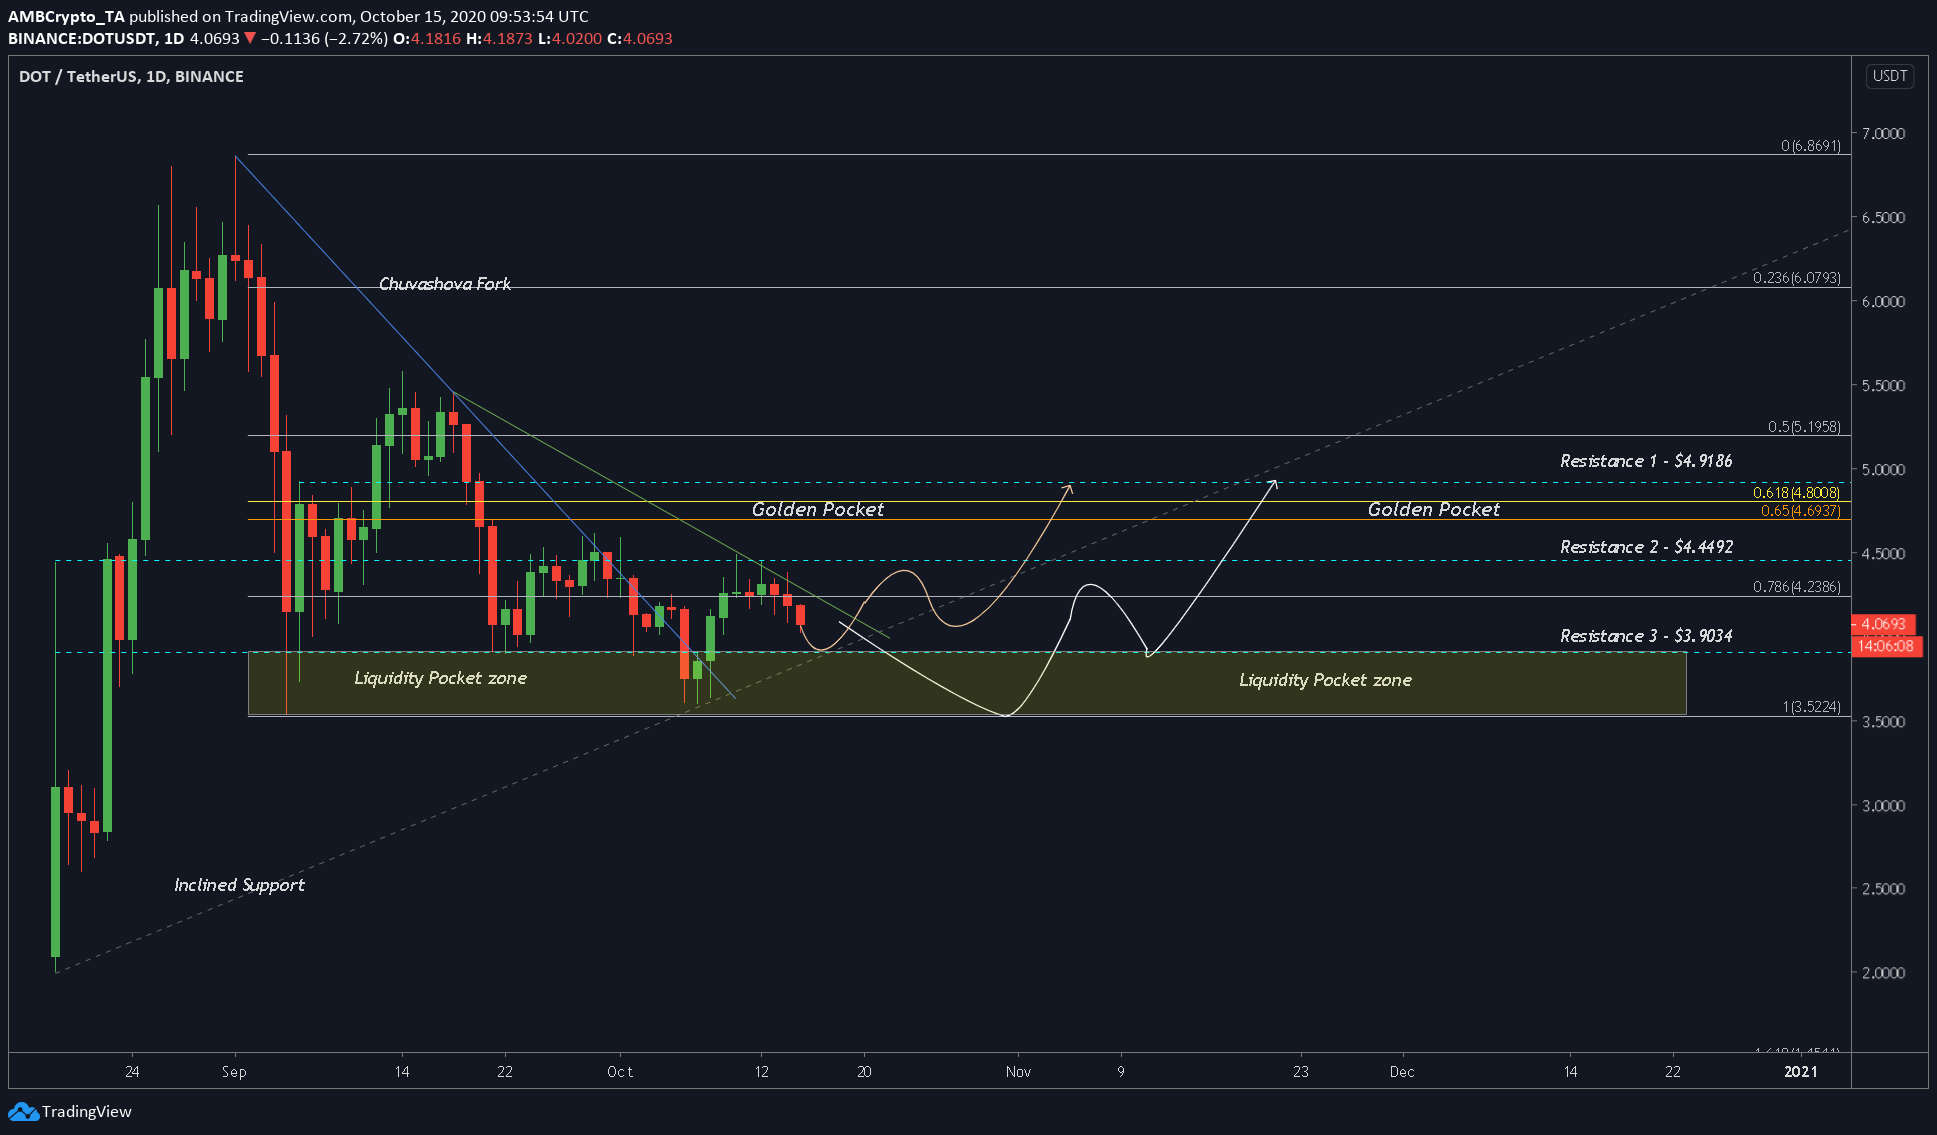
The attached chart has a lot of parts to it, so, let’s move from left to right. The Chuvashova Fork is the blue and green line together. Based on this fork, the reversal will happen if the price successfully breaks above the green line. The reason why an upward breakout is being expected here is due to the upward sloping support [inclined support in the chart; dotted gray line].
The fork and the inclined support indicate a consolidation. As this reaches an end, the price will be forced to break out, and identifying that is the target and the goal. Trading this breakout would yield good profits with minimized risk.
As for the support/resistance levels, there are 3 resistance levels that will act as take-profit levels, should the price break out and head higher. Besides support/resistance, there was a liquidity pocket, an area where the price might dip, but recover soon. Any downward selling pressure will be absorbed by this region.
The primary goal of this technical analysis is to figure out the probable direction that DOT might take and trade in. So far, nothing except the consolidation has indicated a bullish move, yet. Hence now, indicators will help decide what steps should be taken.
Both the RSI and Stochastic RSI indicated a bearish move, which is right, considering the price has failed to hold on to the 0.786-Fibonacci level. Hence, the initial direction for the price in the near future will be down.
Here, the price might move in two ways – The first where DOT bounces on the resistance 3 [$3.0934] and heads higher, perhaps even breaking the Chuvashova Fork’s green line. The second move will be the same as before, except, the reversal will happen after the price heads into the liquidity pocket zone.
The end goal of the price will be the same, however – To head higher. Hence, the first target would be $3.0934. Following this, $4.449 and finally, the golden pocket, as shown in the attached chart.