Analysis

Litecoin bulls finds resistance as indicators align with bears despite falling wedge formation
Posted:

Litecoin has been on a roller-coaster ride this year, rising from the lows below the $35-level and surpassing key levels above $100, then sustaining major fall back right after the halving. The digital silver has been on a constant decline since halving and was priced at $56.37, at the time of writing and observed a minor decline of 1.34% as the cryptocurrency market continued to be in a tepid state. Despite signs of a short-term bullish breakout, the coin seemed to be hovering in bear’s realm.
Litecoin one-day chart:

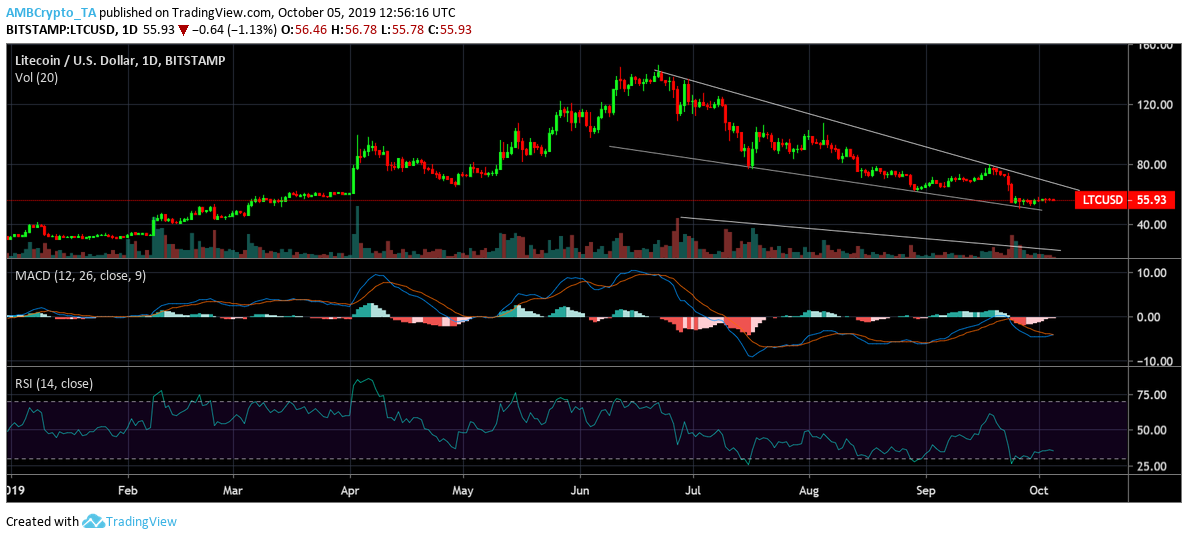
Source: LTC/USD on TradingView
Daily LTC chart exhibited signs of a potential bullish breakout with the formation of a falling wedge pattern as the price followed two down-sloping and converging trendlines. While it seemed that a bullish breakout was imminent, LTC was still trading below moving averages. 50 moving average was below 100 moving average, a trend that has continued since 12th August, when the moving averages underwent a bearish cross-over.
Litecoin underwent a death-cross on 30th August, the trend has been continuing since further depicting the formation of a prominent bearish trend.
50 moving average acted as the immediate resistance which was briefly breached by LTC candlesticks at $77-level on 18th September, following which the price was on a decline. Further providing validity to the bearishness of the moving average was the decreasing trade volume formation in the trend charts.
If downward breakout transpired despite the formation of a falling wedge pattern, LTC could find itself testing support at $44.45, a low that was last breached in February this year.
Indicators confirm bearishness
Source: LTC/USD on TradingView
MACD line was below the signal line after sustaining a bearish cross-over. Additionally, the relative strength index also indicated a high sell signal. RSI was well below the 50 median and hence was indicative of the coin in the oversold level, meaning a prominent bearish sentiment among investors.
Conclusion:
Despite signs of a potential price breakout upwards, the LTC bulls found major resistance as bears continued to dominate the realm as suggested by the moving averages and the indicators.